Basic Principles and Definitions of Metrology
Slides about Basic Principles and Definitions. The Pdf, a presentation, introduces fundamental concepts of metrology, defining key terms such as quantity, measurement, and measurand. It also explains the measurement chain and the differences between transducers and sensors, providing practical examples for university Physics students.
See more16 Pages

Unlock the full PDF for free
Sign up to get full access to the document and start transforming it with AI.
Preview
Basic Principles and Definitions
Francesca Anfuso Ginevra Leni Measurements, Sensors and Instrumentation Daniela Lo Presti 05/03/25 Basic Principles and definitions Today's lecture is going to be entirely focused on the introduction of several concepts, crucial for a smart approach to the subject. It is suggested to take as reference the "Vocabularie International de Metrologia". All the definitions quoted can be found here.
Definitions and Metrology Vocabulary
The guidance document is the International Vocabulary of Metrology (VIM - Vocabulaire International de Metrologie) This vocabulary aims at disseminating scientific and technological knowledge about metrology by harmonizing worldwide the related fundamental terminology. It is meant to be a common reference for scientists, engineers and teachers involved in planning or performing measurements, irrespective of the field of application. It is also meant to be a reference for governmental and inter- governmental bodies, trade associations, accreditation bodies, regulators, and professional societies.
BIPM JCGM 200:2012 International vocabulary of metrology - Basic and general concepts and associated terms (VIM 3rd edition 2008 version with minor corrections Vocabulaire international de metrologie - Concepts fondamentaux et généraux et termes associés (VIM) METE edition Version 2008 avec corrections mineures To begin with, let's introduce some definitions:
Quantity Definition in Metrology
QUANTITY (def. 1.1 - VIM): "Property of a phenomenon, body, or substance, where the property has a magnitude that can be expressed as a number and a reference" For reference we refer to a unit of measure, basically it is the property of something that can be expressed. For instance: Radius of circle, electric charge of the proton ... This definition is crucial since it is indirectly involved into the two following definitions of Measurements and Measurand.
Measurement Definition
MEASUREMENT (def. 2.1 - VIM): "Process of experimentally obtaining one or more quantity values that can reasonably be attributed to a quantity."Last lecture I told you that when we perform a measure of something, that measure cannot be perfect there is always a sort of uncertainty inside that measurement. For measurement we refer to the process used to quantify a quantity that can be reasonably attributed to a value.
Measurand Definition
MEASURAND (def. 2.3 - VIM): "Quantity intended to be measured" The measurement, the process through which we can quantify the quantity, can change the phenomenon itself. If we perform an experiment and a change of temperature is observed, some properties of our quantity may change. Sometimes the quantity and the measurand do not match. For this reason, some correcting tools are applied in order to avoid drastic changes between the measurand and the quantity. For instance, if we want to measure the length of a steel rod at 20°. If the temperature changes the steel rod can also change its dimension because there is a thermal expansion of the rod due to the change of temperature. In that case we need to perform a correction because we actually want to measure the length of the rod when it is equal to 20°. These definitions are always to be interpreted as valid only under specific conditions.
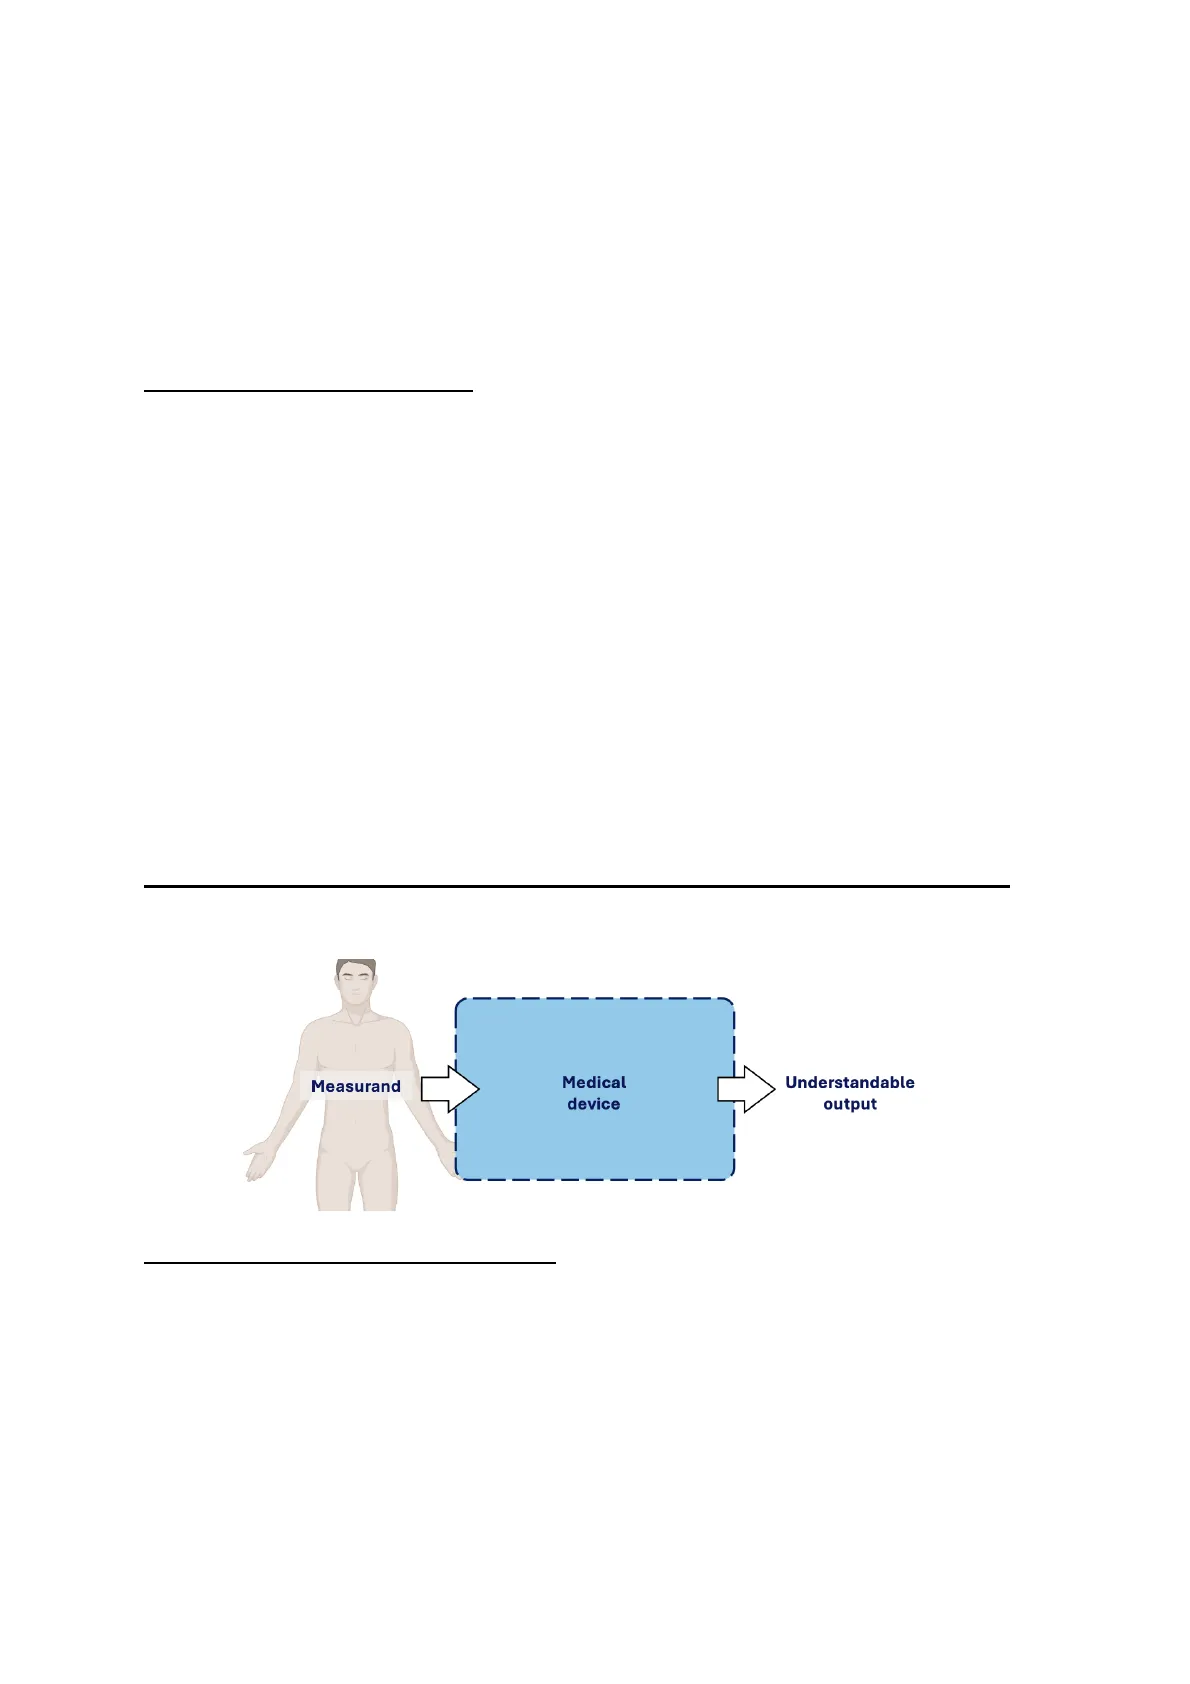
Measurand Medical device Understandable output
Measuring Chain Definition
MEASURING CHAIN (def. 3.10 - VIM) "Series of elements of a measuring system constituting a single path of the signal from a sensor to an output element" In metrology, a series of element of a measuring system that form the measuring chain.X Measuring Transducer or Sensor y Signal Conditioning Indicating or Displaying Measuring Instrument a Medical device The three blocks shown in the picture below, are the principal ones that can be found inside a measuring system (e.g. found inside a medical device)
Figure 1 General representation. There are measuring chains either with additional elements or Inside an ideal measuring system we should be able to find:
- measuring transducers or sensor
- signal conditioning
- output step, indicating or displaying measuring instrument
PQ: What do you think is the "x" signal meaning? In metrology is called the measurand (the quantity that we want to measure)
X Measuring Transducer or Sensor y Signal Conditioning Yʼ Indicating or Displaying Measuring Instrument a In relation with the first block, we find the measurand that represents the input signal (X) and the output of this block is the Y signal. But which is the difference between the concept of measuring transducer and signal?
Measuring Transducer Definition
MEASURING TRANSDUCER (def. 3.7 - VIM) "Device, used in measurement, that provides an output quantity having a specified relation to the input quantity." Y'
Sensor Definition
SENSOR (def. 3.8 - VIM): "Element of a measuring system that is directly affected by a phenomenon, body, or substance carrying a quantity to be measured." Here it is an example to understand better the difference between these two concepts. The bulb thermometer represents a valid instrument to understand this diversity. We have a liquid inside the bulb which is the mercury. This liquid, exchanges energy with the surrounding environment, when you put in contact with the body there is an exchange of energy between the thermometer and the body. This phenomenon takes place until the thermal equilibrium is reached. This energy exchange represents the input signal to the measuring system that in this case is the thermometer. This causes a thermal expansion inside the bulb, resulting in a movement of the liquid inside the capillary of the thermometer. To sum up, we can say that the liquid in the bulb acts as the sensor, because is the element directly affected by the phenomenon, while the capillary represents the transducer (It converts the thermal information into a mechanical movement of the liquid through the length of the thermometer).
X Measuring Transducer or Sensor y Signal Conditioning Y' a Indicating or Displaying Measuring Instrument The second stage is crucial in order to modify the "Y" signal, which is now known as transducer signal because is the output signal of the measuring transducer or sensor stage, modify the signal to a desired magnitude. The most popular stages are:
- Amplification stage
- Filtering stage
The former, increases the magnitude of the input signal, the latter removes (or to decreases) portion of the input. signal that are not considered useful (e.g., band-pass, high pass and low X Measuring Transducer or Sensor y Signal Conditioning Yʼ a Indicating or Displaying Measuring Instrument pass filters). Considering the bulb thermometer, the diameter of its capillary determines how far up the stem the liquid moves with increasing temperature. It "conditions" the signal by amplifyingthe liquid displacement: at the same temperature increment the output variation is different (the smaller the diameter the bigger the height increase) If we take into account the bulb thermometer, the diameter of the capillary conditions our signal, the wider is the dimeter the lower is going to be the height of the liquid inside the capillary. After that we have the third block which is indicating or displaying measuring instrument Usually, the output of the signal conditioning stage can be visualized through a displaying measuring instrument or an indicating measuring instrument.
Indicating Measuring Instrument Definition
INDICATING MEASURING INSTRUMENT (def. 3.3 - VIM): "Measuring instrument providing an output signal carrying information about the value of the quantity being measured"
Displaying Measuring Instrument Definition
DISPLAYING MEASURING INSTRUMENT (def. 3.4 - VIM) "Indicating measuring instrument where the output signal is presented in visual form".
Scale of a Displaying Measuring Instrument Definition
SCALE OF A DISPLAYING MEASURING INSTRUMENT (def. 3.5 - VIM): "Part of a displaying measuring instrument, consisting of an ordered set of marks together with any associated quantity values." For example, in the thermometer we have a set of marks to which we can associate a certain value of the height of the mercury-filled capillary. Just to sum up some concepts, let's make some examples:
Examples of Input and Output Quantities
Bulb Thermometer Example
v Bulb thermometer v Vehicle speedometer V Clock (with hand) Starting from: 1.the bulb thermometer, which is the input quantity (aka measurand)? The temperature The output? The length (usually the height)
Vehicle Speedometer Example
2.Regarding the vehicle's speedometer, which is the input? The speed The output? The arc of a circle
Clock Example
3.Lastly, about the clock, which is the input? The time The output? The arc of a circle How can we associate that number in the set of markers to our measurand? Through the process of calibration, used to establish the relation between our output and our input.
Calibration Definition
CALIBRATION (def. 2.39 - VIM): Operation that, under specified conditions, in a first step, establishes a relation between the quantity values with measurement uncertainties provided by measurement standards and corresponding indications with associated measurement uncertainties and, in a second step, uses this information to establish a relation for obtaining a measurement result from an indication.
How to Carry Out Calibration
How to carry out the calibration? X Y x1,8x1 y1,8y1 x2,8x2 y2,8y2 .. .. xn,ôxn yn,ôyn A theoretical approach cannot be used. The knowledge of the transfer functions of the various stages of the measuring chain allows calculating the transfer function of the whole system (i.e., the measuring chain). However, it is not possible to theoretically calculate the input-output relationship of the various stages, therefore it is required to experimentally carry out the calibration. Generally, we can identify two stages. In a first step, establishes a relation between the quantity values with measurement uncertainties provided by measurement standards and corresponding indications with associated measurement uncertainties and, in a second step, uses this information just received to establish a relation for obtaining a measurement result from an indication. It is important to keep in mind to determine the condition into which we are performing the calibration process.After the first stage we obtain an X, Y plot just like the one below:
During the second stage, we establish a relationship between the output and the input. We 10 . Measured values 1600 - Veut [mV] - Curve fit, y = f(x) 1500 Linear Range 8 1400 Output value, y (units) 6 1200 Experimental data -Model 1100 4 1000 2 900 2 800 1 700 0 0 50 100 150 200 250 0 0 2 3 4 5 Mass Flow Rate $ [mg/s] have the same plot obtained after the first stage, but now we have a fitting of the data. We have not only a relationship of each specific value, but also a curve, a function.
Calibration Curve Definition
CALIBRATION CURVE (def. 4.31 - VIM): "Expression of the relation between indication and corresponding measured quantity value" At the end of the calibration process, we obtain the calibration curve that is the fitting that allows us to find the relationship between our output and corresponding measurand signal.
Figure 2Some examples of calibration curves The calibration is usually described as a static process, if you see the plot below, you do not notice any dependence on the time. No value of X depends on Y values.
X Y x1,8x1 y1,ôy1 x2,8x2 y2,8y2 y=f(x) : xn,ôxn yn,ôyn 12 Input value, x (units) curva taratura · dati sperimentali 1300
Can’t find what you’re looking for?
Explore more topics in the Algor library or create your own materials with AI.
