Uniform Sections Costing: Direct and Indirect Cost Allocation
Slides from Universitat Politècnica De València about Uniform Sections Costing. The Pdf, a university-level economics presentation, details cost accounting principles, secondary repartition methods, and practical examples for allocating indirect costs to products.
See more39 Pages


Unlock the full PDF for free
Sign up to get full access to the document and start transforming it with AI.
Preview
Direct Costs and Indirect Costs
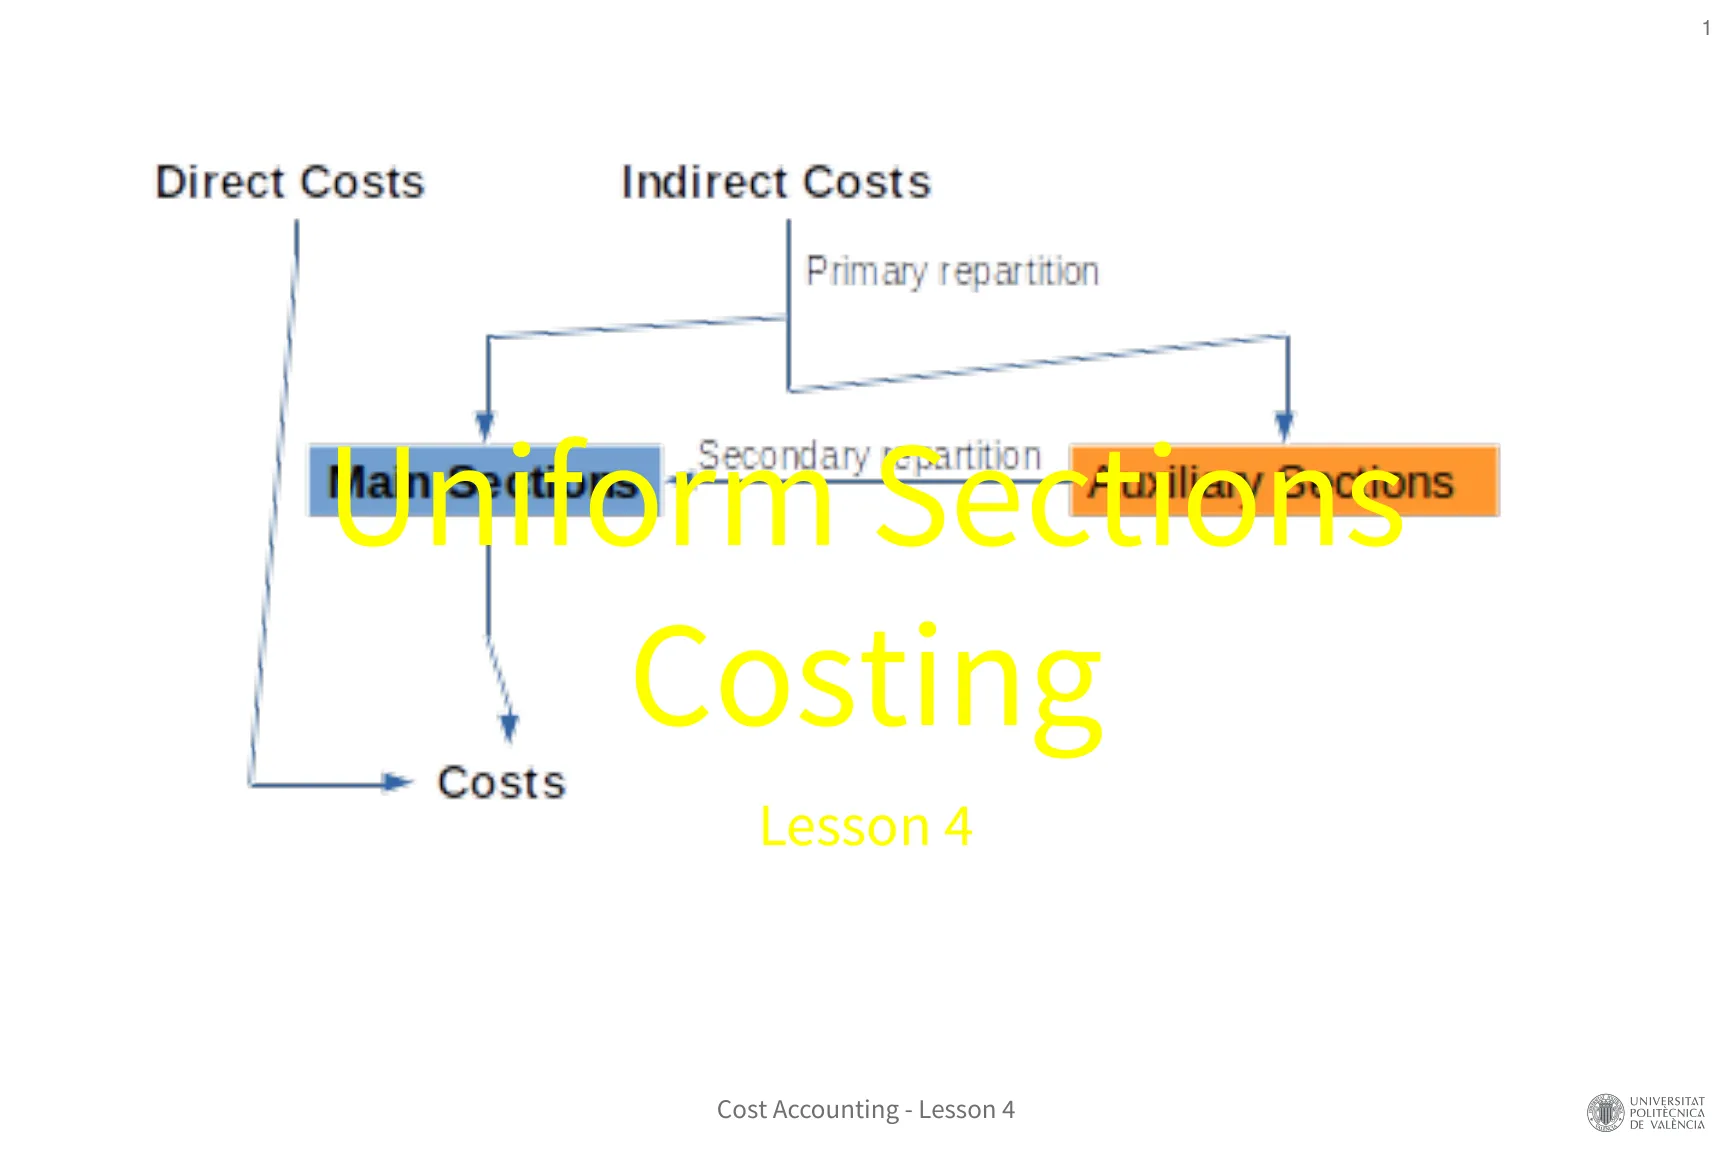
Direct Costs Indirect Costs Primary repartition Uniform Sectionsns Costs Costing
Cost Accounting - Lesson 4
Why Use Sections in Cost Accounting
- To deal with indirect costs . In order to minimize subjectivity in cost accouting and to help making decisions the information is ordered following reponsability areas . The main goal is to divide indirect cost among products . There can be indirect costs, that are direct within a section so there can be directly assigned to the product . Each activity carries out a part of the production process, so all the costs of the section should be assigned to the production process
Why Use Sections II: Company Division Considerations
- To divide the company into sections we must take into account: Technical-economic characteristics as well as the specific company activity · The goal of the company when creating the sections . A good example would be the cost of cleaning products. They are used to keep the premises clean, and that cost cannot be easily assigned to products. . It would be a cost of the cleaning section. . It would not be rational to share out that cost to all the sections but to the sections which use it. Then these sections would assign the cost to the manufactured units.
Introduction to French Method Costing
- French method · Common in France or Spain, not so much in anglophone countries . The firm is viewed as a sequence of stages or sections, that names the costing system
Functional Explanation of Uniform Sections Costing
Indirect resources Step # 1 Purchasing Step # 2 Manufacturing Step # 3 Distribution A B C A B C A B | C Product X Cost of material purchased Cost of products manufactured Cost of goods sold More resources are consumed ... Uniform Sections Costing (from : https://www.researchgate.net/publication/241132476 French Cost Accounting Methods: ABC and other Structural Similarities)
Uniform Section Definition
- A uniform section is an actual division of the company made up by a group of means and resources in order to achieve a common goal · Main features: It is an accounting entity It is a cost control and cost assign center. It is a responsability center to solve the indirect cost assignation issue. It has a responsible person Its activity can be measured by a common unit called working unit. This common unit allows the section to be controlled and the indirect costs to be assigned
Explanation of Section Types
- The firm is viewed as a sequence of stages or sections · Material moves as it is processed into a finished product . These sections, modeled on the production process, are called the Main Sections when they contribute directly to the manufacture of a product . Main Sections gather Purchasing, Production and Distribution functions · Auxiliary (secondary) Sections (e.g. administration, etc.) contribute indirectly to the manufacture of a product . Auxiliary sections costs are assigned to the Main Sections before being eventually allocated to products · Sections represent cost pools
Explanation II: Resources and Cost Objects
Resources Direct resources Indirect resources Repartition Sections Allocation Cost objects (products, services, etc.) Uniform Sections Costing (from : https://www.researchgate.net/publication/241132476 French Cost Accounting Methods: ABC and other Structural Similarities)
Explanation III: Cost Repartition
Direct Costs Indirect Costs Primary repartition Secondary repartition Main Sections Auxiliary Sections Costs
Steps for Uniform Section Costing
- Classify cost into direct and indirect
- Primary assignation of indirect costs among sections or departments
- Secondary assignation from auxiliary sections to main sections
- Allocation of main sections cost to products
Secondary Repartition Methods
- The secondary repartition can be: Direct: It assumes that if the auxiliary section A provides to auxiliary section B then B cannot provide to A · SA -> SB SB X SA Reciprocal or mutual: auxiliary section A provides to auxiliary section B which also provides to auxiliary section B · SA -> SB SB -> SA · More complicated than just using a percentage
Secondary Direct Repartition Example
200.000 400.000 S1 S2 25% 50% 75% 50% SA SB 300.000 200.000 Let us assume that there is a company structure in 2 main sections (SA, SB), and 2 auxiliary sections (S1, S2). For S1 the working unit is hours/worker, for S2 the working unit is hours/machine. Auxiliary Primary S1 S2 SA SB Hours/workers 1,000 500 600 Hours/machine 800 200 600 Primary cost 200,000 400,000 300,000 200,000 Auxiliary Primary S1 S2 SA SB Primary cost 200,000 400,000 300,000 200,000 Repartition S1 -200,000 100,000 100,000 Repartition S2 -400,000 100,000 300,000 Final Cost 0 0 500,000 600,000
Secondary Mutual Repartition Example
- When two auxiliary sections provide services to each other (mutual repartition) we cannot use preset percentages anymore · We need: " to set an equation system that models the relationships between sections · to solve the equation to obtain the whole cost of the auxiliary sections " to assign the auxiliary sections cost to primary sections to obtain the total cost in each primary section
200.000 400.000 40% S1 S2 50% 10% 25% 25% 50% SA SB 300.000 200.000 Transfer coeff S1 = 200,000 + 0.5 · S2 S2 = 400, 000 + 0.4 · S1
Secondary Repartition Matrix Resolution
PC = I -T] . S [I -T] ] . PC = [I -T]]. [I -T] . S I -T-1 . PC = I . S S = I -T]] . PC PC: primary cost (known) T: coefficients transfer matrix (known) I: identity matrix (known) S: secondary cost (after repartition) (unknown)
Subactivity Treatment in Cost Accounting
. Subactivity means a low use of the available capacity . A company, deparment or center is having subactivity when they are not using their resources in the production process completely · Some examples: Time cost of a worker that is not working because the production line is stopped · Depreciation cost of machine that is not used . Cost accounting faces subactivity by creating an artificial section, the subactivity section, that gathers the subactivity cost and also the overactivity profits
Working Out Subactivity Cost
Cost Accounting - Lesson 4 UNIVERSITAT POLITECNICA DE VALENCIA20
Indirect Fixed Costs Example: Truck Depreciation
Only for indirect fixed costs Example: truck depreciation V = 100,000 € Expected life = 10 years Annual depreciation = 10,000 €/y Work unit: km/year Over-activity Sub-activity Normal km/year 50,000 km/y 50,000 km/y Real km/year 62,500 km/y 40,000 km/y Activity coeff. 1.25 0.8 Cost (COGM) 10,000 x 1.25 = 12,500 € 10,000 x 0.8 = 8,000 € Sub/over activity 2,500 € ( over) - 2,000 € (sub) For COGM - 12,500 € - 8,000 € In period costs + 2,500 € - 2,000 € Accounting Cost -10,000 € -10,000 €
Rational Imputation Steps
- Split up direct and indirect costs
- Split up indirect costs into variable and fixed
- Work out the activity ratio (actual activity / standard activity)
- Work out subactivity cost or overactivity profit
- Primary repartition
- Secondary repartition
- Imputation of main sections to products
- When computing the overall (company's) result include the subactivity section
Exercise 4.1: Subactivity Cost Calculation
Work out the subactivity cost or the overactivity profit In the bottling section of a winery, the working unit is the number of bottled units If production is 1,000 bottles and fixed costs amount to 100,000 m.u. , the unit fixed cost is 100 m.u./unit
Exercise 4.2: Departmental Cost Calculation
A regional government is organised in several departments. For each of them we know the consumption of the last year (m.u./year) Resources Urban planning Culture and sport Tax Environment Civil servants 21,728.00 10,000.00 150,000.00 15,000.00 Materials 10,000.00 4,629.20 50,000.00 20,000.00 Lease and depreciation 25,000.00 5,000.00 125,925.00 20,000.00 Energy 3,000.00 5,000.00 80,000.00 6,604.60 Civil servants 2,000.00 5,000.00 20,000.00 10,000.00
Exercise 4.2: Secondary Repartition
Besides we know the relationships between departments.Work out the the cost of each department after the secondary repartition 60% Tax + 25% Culture and Sport + 40%. Environment Urban planning -50%
Exercise 4.3: Product Costing with Sections
A company produces three types of products T, B and C. The company is structured in sections which the following functions: · Transport · Setup · Cutting · Assembling · Control · Packaging Table 1 shows the direct cost consumption for each product Table 1. Direct costs Direct costs Total T B C Direct Labour 20,000,000 5,000,000 6,000,000 9,000,000 Raw materials 15,000,000 3,000,000 4,000,000 8,000,000
Exercise 4.3: Indirect Costs and Work Units
Table 2 shows the indirect costs and their distributions among sections or products. Each section activity is measured by means of working units, considering a regular activity level and a recording the actual level (table 3) Table 2. Indirect cost per section Indirect Costs Total Transport Setup Cut Assembling Control Packaging Indirect labour 1,000,000 10% 25% 25% 5% 5% 30% Materials 2,500,000 10% 80% 10% Fuel 5,000,000 80% 20% Lease 5,000,000 40% 40% 20% Table 3. Work units consumption Activity ratio Transport (km) Setup (h/m) Cut (h/m) Assembling (kg mp) Control (pieces) Packaging (pieces) Standard 12,000 1,500 8,000 100,000 10,000 10,000 Actual 15,000 1,500 6,500 80,000 12,500 12,000
Can’t find what you’re looking for?
Explore more topics in the Algor library or create your own materials with AI.
