Introduction to Engineering Materials: Stress-Strain Behavior and Temperature Effects
Slides from University of Liverpool about Introduction to Engineering Materials. The Pdf, a presentation for University-level Physics, analyzes stress-strain behavior, including necking, strain rate, and temperature effects on materials, with graphs and tables. Authored in 2023.
See more17 Pages

Unlock the full PDF for free
Sign up to get full access to the document and start transforming it with AI.
Preview
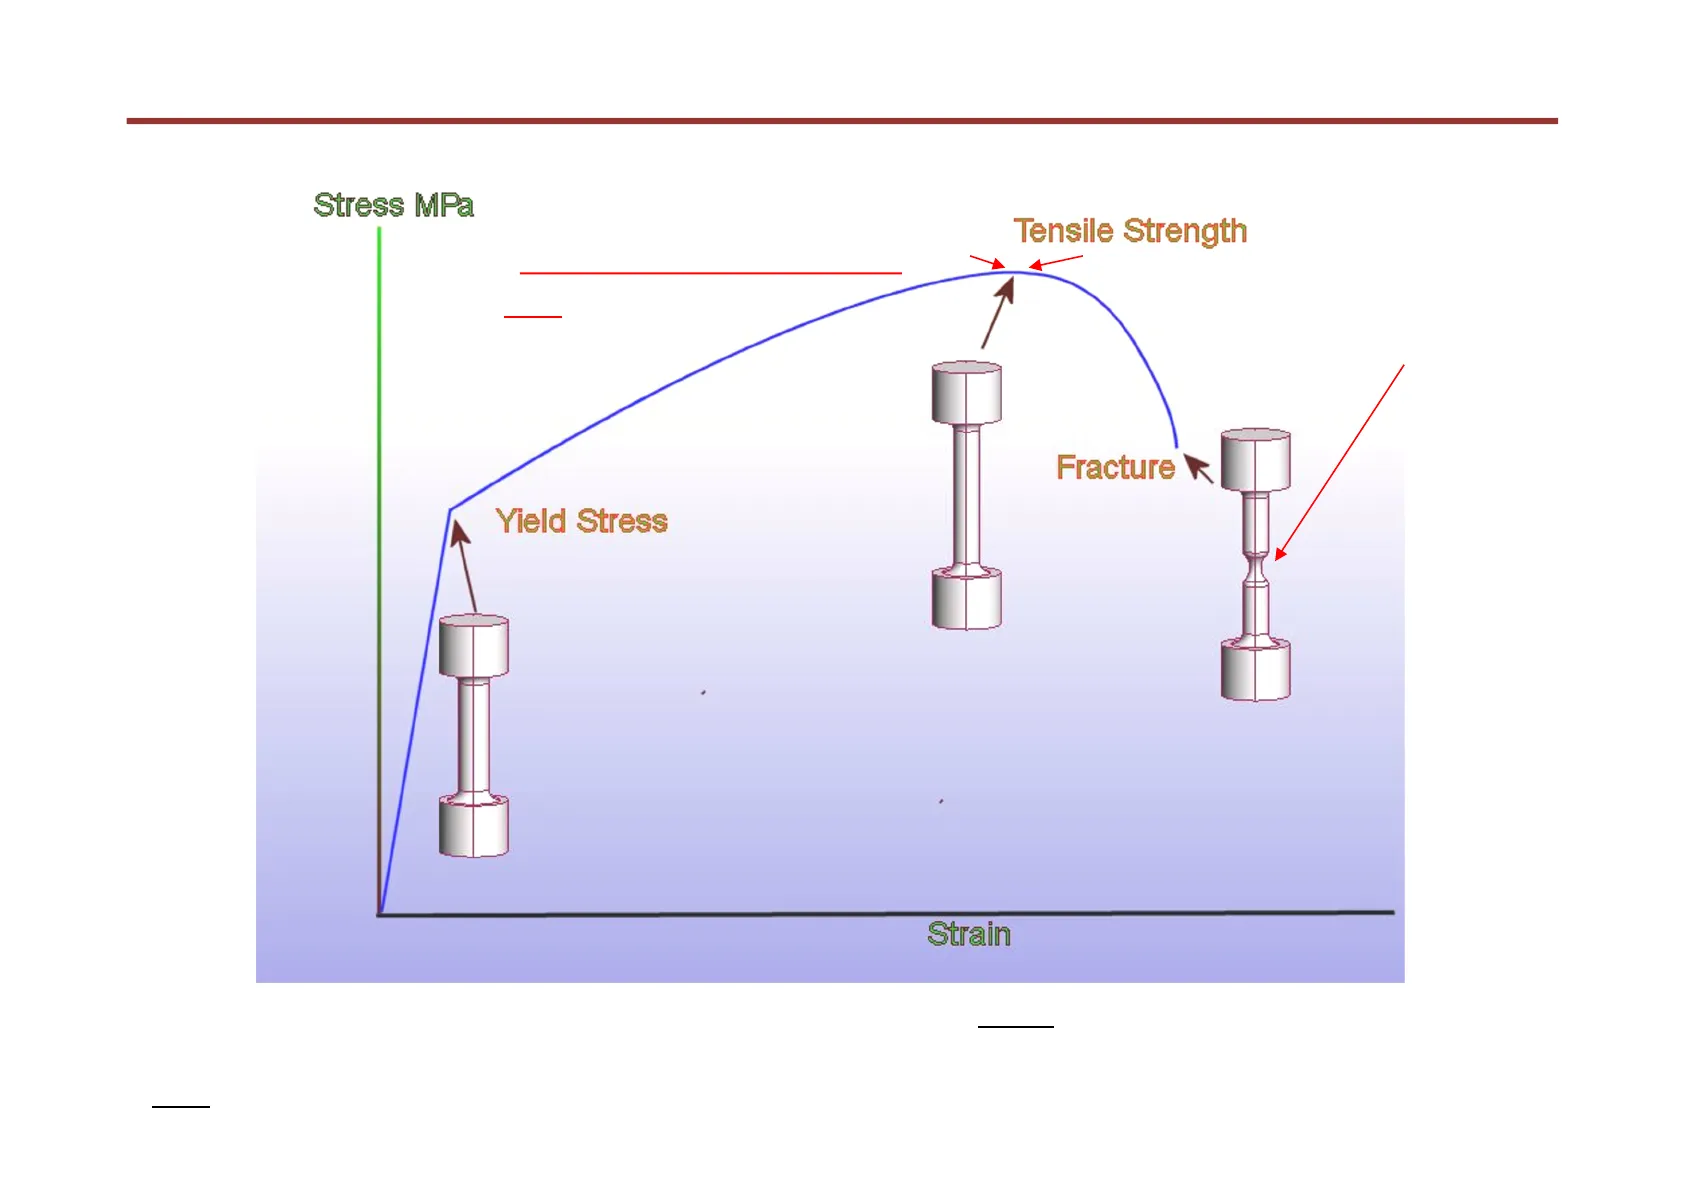
Typical Stress-Strain Behavior in a Tensile Test
Stress MPa The maximum stress is called the "tensile strength" or "ultimate tensile strength, UTS" of the material Tensile Strength A "neck" forms after the UTS (tensile strength) Fracture Yield Stress After the UTS all plastic deformation is concentrated in the neck. Final fracture occurs in the neck. Strain Note: in this stress-strain graph, the Stress = (applied load) / (initial cross-sectional area). But during a tensile test, the test piece cross-section area decreases (to conserve volume, as it elongates). Hence the true (real) value of tensile stress experienced locally in the centre of the test piece will be greater ..... (more later)
True Stress & True Strain During Deformation
UNIVERSITY OF LIVERPOOL When calculating stress and strain (from e.g. a tensile test) we have so far used: Stress = F/A0 = (applied load) / (initial cross-sectional area), and Strain = Dl/lo = (change in length) / (initial length). But in reality, during a tensile test, the test piece cross-section area decreases as its length increases. Hence the real true tensile stress experienced locally in the centre of the test piece will be greater than this, and the real true strain will be lower ..TRUE Stress & TRUE Strain during deformation UNIVERSITY OF LIVERPOOL The "true stress, o" and "true strain, &" are the real stress and strain carried by the sample, as the sample will have an instantaneous cross-section area and length different to its starting area and length once it has started to deform. The true stress never decreases during a tensile test ....
True Stress vs. Engineering Stress
O VS. E true Stress o. VS. e engineering In the tensile test the "engineering stress, o." and "engineering strain, e" are the stress and strain calculated from the original starting dimensions. Strain
Calculating True Stress & True Strain from Engineering Stress & Strain
During plastic deformation, as a sample extends under tension: • the applied load F is actually carried by the instantaneous cross-section area A (which is always smaller than the starting cross-section area A.), and • an extension Al represents a decreasing fraction of the actual length I of the sample. true stress: 0 = F/A [Engineering stress, o0 = F/A. ] true strain: E = In(1/10) = log(1/10) [Engineering strain, & = (I-lo)/10] ["I" is the final length, and "I." the initial length] These are the actual ("true" or real) stress and strain at any instant. True stress and true strain (o, ¿) are related to engineering stress and engineering strain (o., e) by: o = 0 (1+e) E = In (1+e) = loge(1+e) 2.718 Eng. strain
Proofs of True- & Engineering- Stress & Strain Relationships
1. True Stress Proof
• During purely plastic deformation the VOLUME of metal remains approx constant: i.e. A.I = A .. I. or A = A. (Io / 1) • So the true stress o = F/A = (F/A.). (I/l.) but F/A. is the engineering stress o., SO O = ? 0.(1/10) • Now, engineering strain: e = (I-lo)/lo = (1/10) - 1, so I/l = ? 1+e • Therefore: true stress o = ? o.(1+e )
2. True Strain Proof (Calculus)
• An infinitesimal length increase dl imposed on a specimen of current length I corresponds to a strain increment de = dl/l (not dl/lo). • During deformation, the length increases continuously from lo to I, so the total true strain, e, is the sum (i.e. the integral) of all the small strain increments de: i.e. true strain & = I'de dl/ I = Inl - In lo = In (l/10) = I lo and as l/lo = 1+e, E = ln (1+e)
True Stress vs. True Strain: Why So Useful
UNIVERSITY OF LIVERPOOL o VS. E Stress true So VS. e engineering Strain For many metals: O= K . E n where K is a constant, n is the strain-hardening exponent (typically 0.1 - 0.6) This allows engineers to simulate plastic deformation processes - very useful ! And can find K and n from experimental tensile tests by calculating the true stress and true strain at the UTS. as: EUTS is equal to the true strain at the UTS K can be found, as o UTS = K. EUTS " [OUTS is the true stress at the UTS]
True Stress vs. True Strain: Practical Application
UNIVERSITY OF LIVERPOOL O VS. E Stress OUTS e "true" + - LUTS 1 AUTS o. VS. e " engineering - measured in a tensile test EUTS CUTS Strain s K &n where K is a constant, n is the strain-hardening exponent (typically 0.1 - 0.6) And can find K and n from experimental tensile tests (o. vs. e) by calculating the true stress and true strain at the UTS as: n is equal to the true strain at the UTS, EUTS = In (1+eUTS) K can then be found, as at the UTS: Ουτς = Κ. ευτς η [OUTS is the true stress at the UTS]
Material Properties: K and n Values
UNIVERSITY OF LIVERPOOL True M' Corrected Stress M Engineering Strain K Material n MPa psi Low-carbon steel (annealed) 0.21 600 87,000 4340 steel alloy (tempered @ 315℃) 0.12 2650 385,000 304 stainless steel (annealed) 0.44 1400 205,000 Copper (annealed) 0.44 530 76,500 Naval brass (annealed) 0.21 585 85,000 2024 aluminum alloy (heat-treated-T3) 0.17 780 113,000 AZ-31B magnesium alloy (annealed) 0.16 450 66,000
Poisson's Ratio, v
UNIVERSITY OF LIVERPOOL Tensile stress D D l • The (+ve) longitudinal true strain (increase in length) is: ? 81 = In (1/1.) • The reduction in diameter from D. to D represents a (-ve) transverse (lateral) true strain: ? &t = In (D/Do) . The ratio - & /& is called Poisson's ratio, V For elastic deformation, usually v = 0.25 - 0.3. (Also note that the volume of a sample DOES actually change slightly during elastic deformation). For plastic deformation (e.g. during forging, extrusion) v ~ 0.5 for any metal. (And the volume often does NOT change significantly during plastic deformation).
Effect of Deformation Strain-Rate and Temperature on Stress-Strain Behavior
function of time
Effect of Strain-Rate (¿) on Stress-Strain Behavior
UNIVERSITY OF LIVERPOOL "How fast you deform a metal" normally has a small, but sometimes important, effect on the flow-stress (yield stress): o a (¿)m where typically m < 0.025 Rate 2 (> Rate 1) s Rate 1 Q. If m = 0.025, a strain-rate increase of 100x increases the flow (yield) stress by ?% 12.2% because o a = (¿2/1 )0.025 = (100/1)0.025 = 1.122 3 However, for some polymers, the effect of strain rate can be very dramatic: 1400 1200 Polyethylene 1000 Force/N 800 600 - 400 - 10 mm/min 200 20 mm/min 0 0 100 200 300 Extension/mm
Effect of Temperature: Cold-Working and Work-Hardening
Effect of temperature: Most metals work-harden and become stronger during plastic deformation at near room temperature at T ≤ 0.3Tmelt (in Kelvin). This is called cold- working: The "work-hardening rate" = do/de, is the gradient of the slope of the o vs. & curve, and generally decreases with strain. NB The term "flow stress" is often used in manufacturing It is "the stress required to continue plastic deformation" at any point during deformation, and generally increases with strain. For many metals: o K &n where K is a constant, n is the strain- hardening exponent (typically 0.1 - 0.6) True Stress, o 1 Higher flow stress after lots of plastic deformation Flow stress at start of plastic deformation (= yield stress) True Strain, &
Effect of Temperature: Cold and Hot Working
UNIVERSITY OF LIVERPOOL (NOTE: All temperatures in KELVIN !!! ) • At T < 0.3T melt (usually including room temperature) most metals work-harden. This cold-working increases strength and hardness, but decreases ductility (become more brittle). . The ductility can be restored by annealling, i.e. heating to a temperature typically above about 0.4T - 0.5Tm (in K) so that internal stresses disappear as new un- deformed grains form: called recrystallisation. Strength decreases and ductility increases back to pre-coldwork levels. . If you deform at T > 0.5T_ all metals are relatively soft and don't work harden. During this hot-working, the internal structure recrystallises simultaneously with deformation, and the metal stays soft and ductile. (However grain-growth and oxidation can cause problems.) Steel Cu Al Pb T melt 1370ºC 1085℃ 660℃ 328ºC 0.3 x T (K) melt 220ºC 135℃ 10℃ -90°℃ 0.5 x T melt (K) 550°C 400℃ 195°C 28℃
Effect of Temperature: Microstructure and Properties
UNIVERSITY OF LIVERPOOL (NOTE: All temperatures in KELVIN !!! ) PROPERTIES: hardness strength ductility ~0.3T, m ~0.5T m temperature cold worked and recovered new grains MICROSTRUCTURE: recovery - grain growth recrystallization - Cold- working Hot-working
Effect of Temperature: Stress-Strain Behavior in Cold and Hot Forming
UNIVERSITY OF LIVERPOOL Stress-Strain behaviour Cold-forming (T < 0.3Tmelt) • Work-hardening (flow stress increases with strain): Otrue Etrue . Approximate by σ true K.En true Hot-forming (T > 0.5Tmelt) • Recrystallisation simultaneous with plastic deformation. . Approximate by assuming a constant mean yield (flow-) stress Y. Otrue Y Etrue i.e. Otrue ~ Y
Stress-Strain Behavior of Steel at Different Temperatures
UNIVERSITY OF LIVERPOOL e.g. stress-strain behaviour of STEEL at different temperatures ºC 200 320 Cold-work Stress (MPa) 400-24ºC 100 7 430 480 300 540 200 600 } Hot-work 650 100 0 0 0.02 0.04 0.06 0.08 0.10 0.12 Strain 500 24
Can’t find what you’re looking for?
Explore more topics in the Algor library or create your own materials with AI.
