Environmental Implications of Livestock Systems by Qut Isr Presentation
Slides from Qut Isr about Environmental Implications of Livestock Systems. The Pdf provides an in-depth analysis of environmental impacts, including greenhouse gas emissions like methane and nitrous oxide, relevant for University students in Environmental Education.
See more68 Pages

Unlock the full PDF for free
Sign up to get full access to the document and start transforming it with AI.
Preview
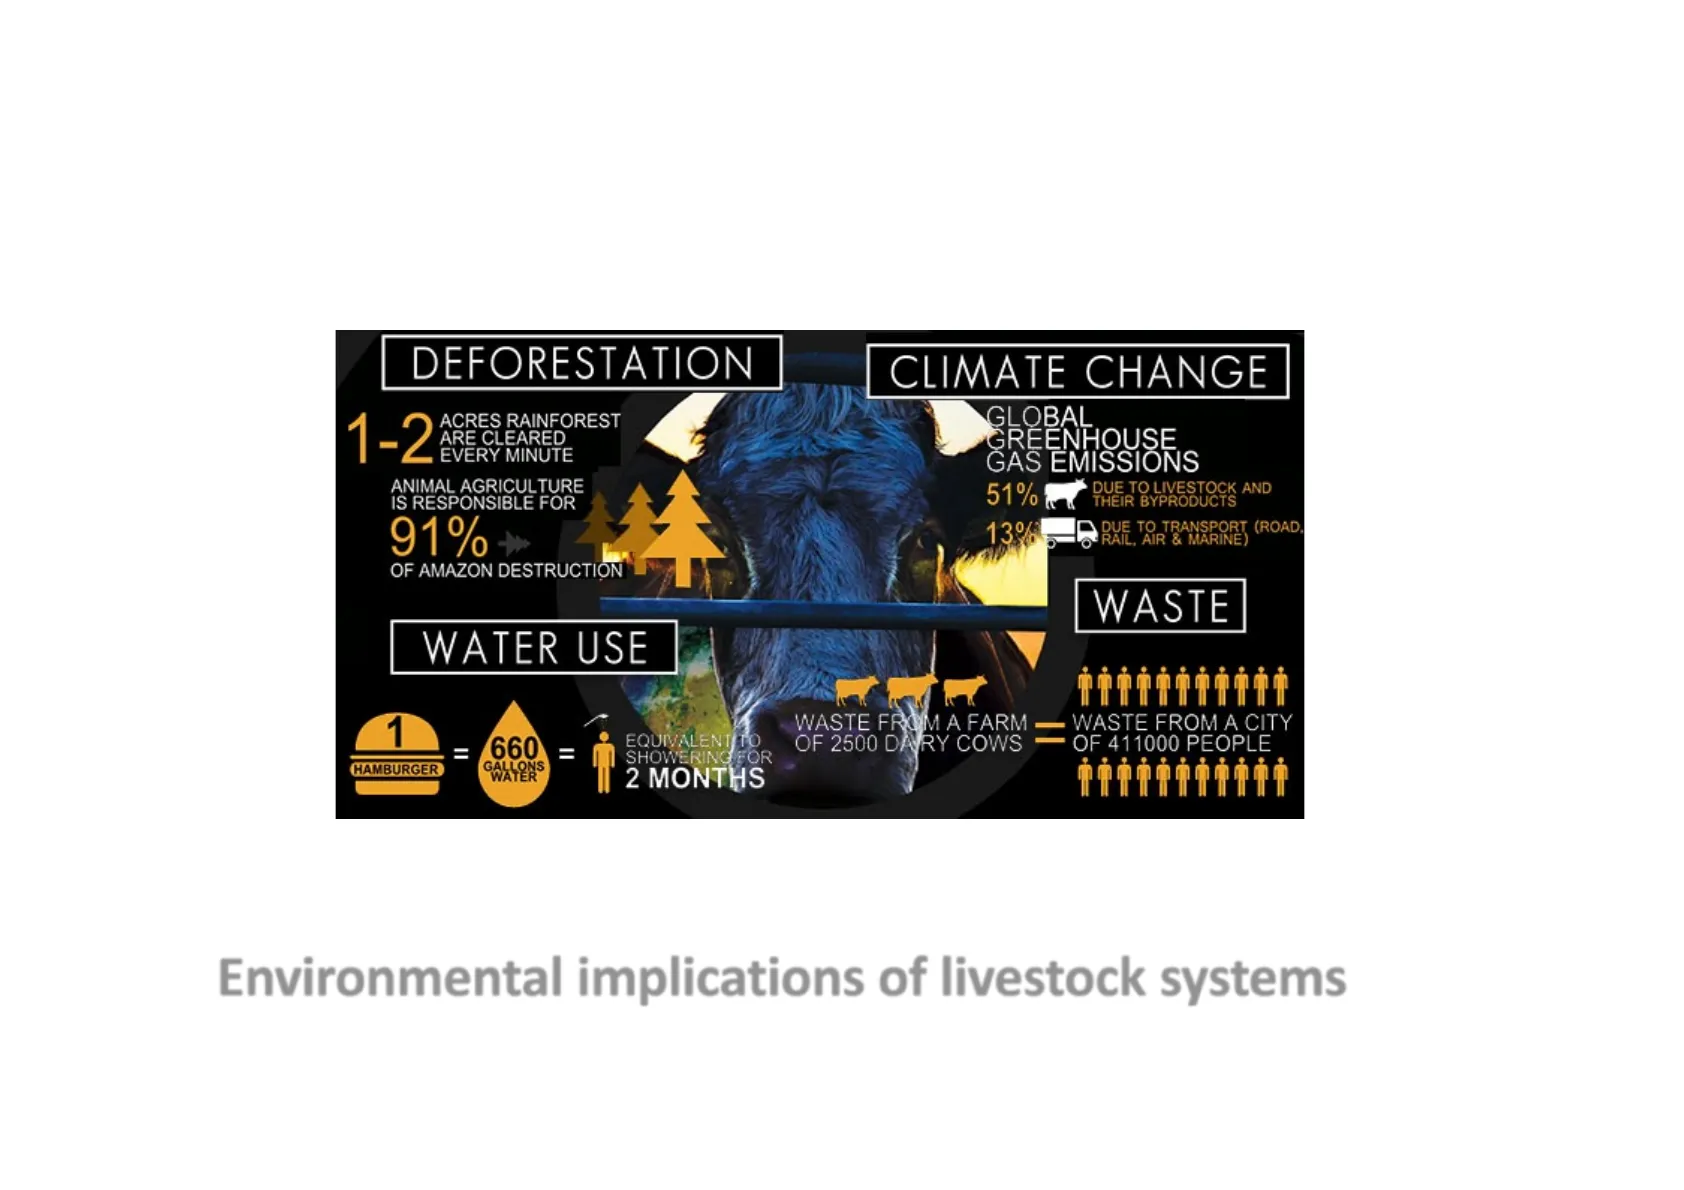
Deforestation and Climate Change Impacts
Unit 3 DEFORESTATION CLIMATE CHANGE
- 2 ACRES RAINFOREST ARE CLEARED EVERY MINUTE
Global Greenhouse Gas Emissions
GLOBAL GREENHOUSE GAS EMISSIONS ANIMAL AGRICULTURE IS RESPONSIBLE FOR 51% DUE TO LIVESTOCK AND THEIR BYPRODUCTS
- 1% 13% DUE TO TRANSPORT (ROAD, RAIL, AIR & MARINE) OF AMAZON DESTRUCTION
Waste and Water Use in Agriculture
WASTE WATER USE 1 = 660 GALLONS WATER E WASTE FROM A FARM OF 2500 DAIRY COWS WASTE FROM A CITY OF 411000 PEOPLE HAMBURGER EQUIVALENT TO SHOWERING FOR 2 MONTHS
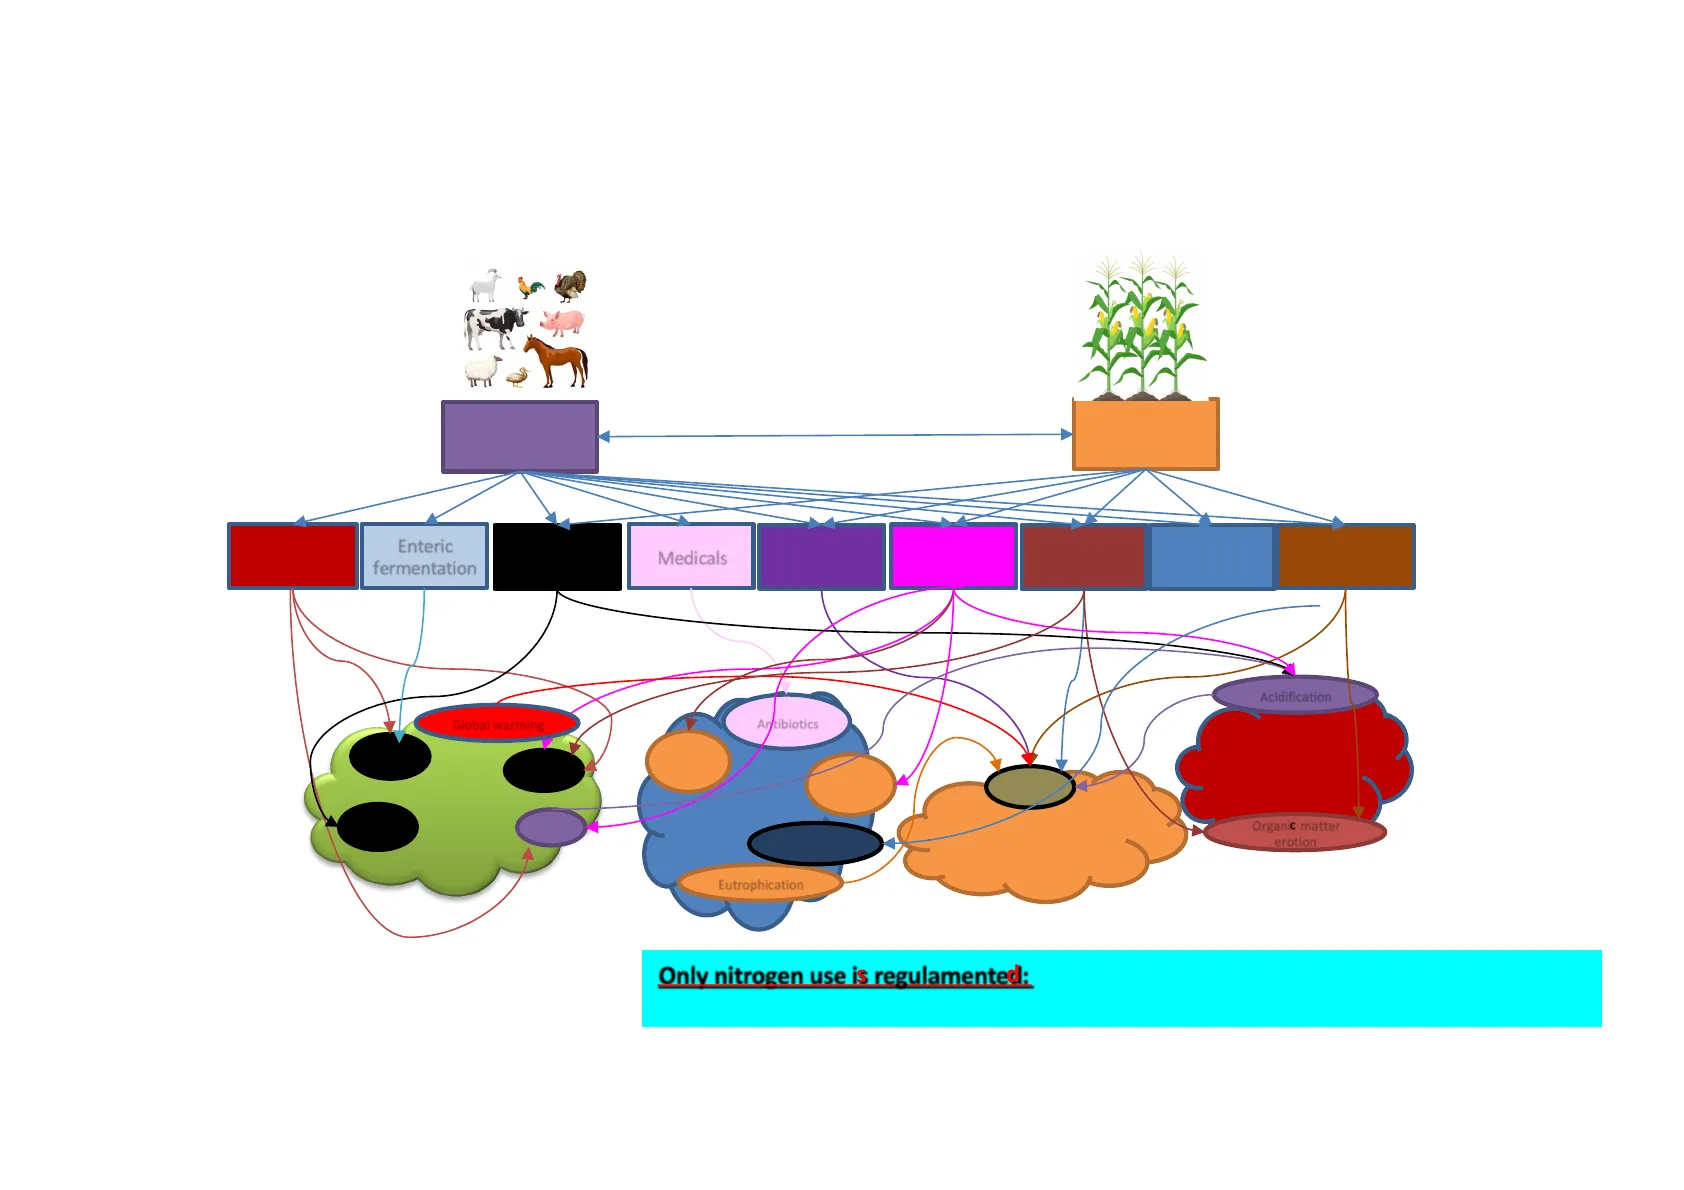
Environmental Implications of Livestock Systems
Environmental implications of livestock systemsLivestock and environment Tr Animal farming Feed production Manure managemen t Enteric fermentation Energy use Medicals Pestisides Fertilisers Land use water use Deforestatio n Acidification Global warming Antibiotics NO3 CH4 N2 O - los PO43- Air Water Biodiversit CO2 N H3 Organic matter erotion wasted y Eutrophication
Only nitrogen use is regulamented: The Nitrates Directive (http://ec.europa.eu/environment/water/water-nitrates/index_en.html) SoilClimate change 18% of GHG (in CO2 eq.) Of which: 9% CO2 37% CH4 (GWP 25> CO2) 65% N2O (GWP 300> CO2)
Water Consumption and Biodiversity
Water consumption livestock's long shadow environ Steinfeld et al. 2006 8% of global water consumption and release of pollutants (antibiotics, hormones, fertilizers and pesticides)
Biodiversity Threats from Livestock
Biodiversity 306 of 825 ecosystems (WWF) are threatening by livestock productionsConsumi proteine di origine animale
Global Population Growth and Food Demand
L'incremento mondiale della popolazione e il cambiamento delle abitudine alimentari nei paesi emergenti sta determinando un aumento della domanda degli alimenti di origine animale 7 BILLION PEOPLE 9 BILLION PEOPLE 60 BILLION LAND ANIMALS 2012 100 BILLION LAND ANIMALS 2050 Foto by Andras Forgacs
The Challenge of Sustainable Food Demand
La grande sfida che ci attende: Soddisfare questa domanda in modo sostenibile e in un contesto di cambiamento climaticoFeed the earth
The global population growth and changing eating habits in developing countries increases food demand
Global Consumption Projections
2000 Global consumption 2050 37 kg/year x 6.2 billions pop 52 kg/year x 9.2 billions pop = = 229 t x106 478 t x106 78 kg/year x 6.2 billions pop. 100 kg/year x 9.2 billions pop. = = 485 t x106 920 t x106 Nardone et al., 2008Increasing primary production
Agricultural and Livestock Production Strategies
Agricultural and livestock may satisfy this requirement in two ways : 1) Increasing land use for crops production (deforestation, soil use change) 2) Increasing production per unit of land or per animal (intensification of production process)Forestry loss
Tropical Primary Forest Loss Data
Tropical Primary Forest Loss, 2002-2019 7 6 6.1 Primary forest loss (million hectares) 5 4 3.8 3 2.7 2 0 2002 '03 "04 '05 '06 '07 "08 60, "10 F '12 13 14 "15 '16 17 "18 "19
Forest Loss Data Trends
- Three-year moving average, The three-year moving average may represent a more accurate picture of the data trends due to uncertainty in year-to-year comparisons. All figures calculated with a 30% minimum tree cover density. GLOBAL FOREST WATCH WORLD RESOURCES INSTITUTE
Regional Tree Cover Loss by Driver
Regional Tree Cover Loss by Driver for the Period 2001-2015 59% Wildfire 38% Forestry RUSSIA, CHINA, SOUTH ASIA EUROPE 15Mha 95% Forestry 64Mha NORTH AMERICA 48% Forestry 70Mha 48% Wildfire 61% Commodity- Driven Deforestation 93% Shifting . Agriculture AFRICA SOUTH- EAST ASIA 39Mha 39Mha 24% Shifting 1 --. Agriculture LATIN AMERICA 78Mha 64% Commodity- Driven Deforestation 62% Wildfire OCEANA 10Mha COMMODITY-DRIVEN DEFORESTATION * SHIFTING AGRICULTURE FORESTRY WILDFIRE URBANIZATION *Sistemi di produzione intensivi
Intensive Production Systems
Confinati in stalla Senza terra Alimentazione fornita Elevata genetica Elevata densità Elevate cure veterinarie Elevato uso di energia Elevato uso di tecnologia Elevata produzione/capo C Yann Anthus-Bertrand30/11/2015
Intensive Farming and Greenhouse Gases
Dagli allevamenti intensivi arriva il 20 per cento dei gas serra - Repubblica,it R.it Ambiente Dagli allevamenti intensivi arriva il 20 per cento dei gas serra L'ente protezione animali distrubuisce un documento ai politici italiani per sensibilizzarli su come l'industria della carne faccia male non solo alle bestie ma anche alla salute delle persone. "La Fao prevede che il consumo di carne nel mondo sia destinato a crescere del 73% entro il 2050" di MARGHERITA D'AMICO http://www.repubblica.it/ambiente/2015/11/27/news/pericoli_industria_carne-128274534/?ref=HRLV-16The Greenhouse Effect
The Greenhouse Effect Explained
SUN Some solar radiation is reflected by the Earth and the atmosphere. Some of the infrared radiation passes through the atmosphere, and some is absorbed and re-emitted in all directions by greenhouse gas molecules. The effect of this is to warm the Earth's surface and the lower atmosphere. Solar radiation passes through the clear atmosphere ATMOSPHERE EARTH Most radiation is absorbed by the Earth's surface and warms It. Infrared radiation is emitted from the Earth's surfaceClimate
Climate and Weather Definitions
. Climate tells us about the average or expected conditions in an area and the range of possible conditions, while weather tells us the short-term occurrences. (From Pam Knox, Agricultural climatologist, University of Georgia )Climate Change
Climate Change Definition by IPCC
. A statistically significant variation in the mean state of the climate or its variability, persisting for an extended period (typically decades or longer) (IPCC). . Climate change, as defined here, may be caused by natural internal processes or external forcing or by persistent anthropogenic changes in the composition of the atmosphere or land use.CLIMATE CHANGE
Regional Warming Trends (2006-2015)
Regional warming in the decade 2006-2015 relative to preindustrial Annual average warming ARC ALA CGI NEU NAS CEU WNA CAS TIB CNA /ENA MED EAS WAS SAH 2.25 CAR SAS NTP CAM SEA WAF EAF ETP AMZ WIO 1.5 NAU SAF WSA SSA SAU 0.75 0.0 -0.75 -1.5 -2.25 Estimated warming relative to 1850-1900 (C) -3.0 FROM IPCC NEB STP ANT December-January-February June-July-August 3.0Global Warming
Global Warming Evidences
370 -Temperature in degrees centigrade (compared with 1960-1990 baseline) -Atmospheric carbon dioxide (CO2 in parts per million) 350 330 CO2 (ppm) 310 290 0.0 270 -0.2 250 -0.4 230 -0.6 1000 900 800 700 600 500 400 300 200 100 0 Years Before Present (a) Global atmospheric concentrations of three well mixed greenhouse gases Carbon dioxide 1.5 360 340 1.0 320 0.5 300 280 10€ 0.0 260 Atmospheric concentration 0.4 CH4 (ppb) 1500 Agriculture 0.3 1250 0.2 1000 0.1 750 0.0 Radiative forcing (Wm-2) 0.15 310 Nitrous oxide 0.10 N2O (ppb) 290 Fossil Fuel Use 0.05 270- 0.0 250 1000 1200 1400 1600 1800 2000 Year These are the evidences 1.0 0.8 0.6 0.4 0.2 Temperature (difference) 0.5 1750 Methane CO2 (ppm) Fossil Fuel UseSea Ice Concentration (percent)
Arctic Sea Ice Concentration Changes
50 100 SEPTEMBER 14, 1984 Russia Greenland Canada Alaska (U.S.A) 1,000 km September, 2003 Arctic Ice 1979 and 2003 Credit: NASA/Goddard Space Flight Center SEPTEMBER 13, 2012 Russia Greenland Canada Alaska (U.S.A) 1,000 km Sea Ice Concentration (percent) 0 50 100 September, 1979Which is the climate foreseen for the future.
Future Climate Projections
? Summer months Temperatures 19c GLA 2011-2020 GLA 2021-2030 48N 48N 47N 47N 46N 45N 18c 5 year average temperature 44N 44N 43N 42N 84 83 82 81 39N 39N 3BN 37N 36N- "SE 7E BE 10E 11E 12E 13E 14E 15E 18E 17E 18E 19E 20E GLA 2031-2040 4BN 48N 47N- 47N 73 46N 46N 72 45N 45N 71 44N 44N 70 69 15c 41N 41N 40N 40N- 39N SEN - 3BN 37N 36N BE 7E BE 9E TOE THE 12E 13E 14E 15E 16E 17E 18E THE 20E 10E 11E 12E 13E 14E 15E 16E 17E 18E 19E 20E 1880 1890 - 1900 + 1910 1920 1930 1940 1950 1960 1970 1980 1990 2000 2010 2020 2030 2040 2050 2060 2070 2080 2090 GLA 2041-2050 75 16c 4.3N 43N 68 422N- 42N 39N 14c 37N 6E 7E 9E 10E 11E 12E 13E 14E 15E 16E 17E 18E 19E 20E 76 - IPCC low estimate 41N 41N 40N 40N 17c JBN 79 37N 78 77 IPCC best estimate 42N - IPCC high estimate 43N- Global average temperature 46N 45N 36N 7E BE DE Segnalini et al., 2013 74COP21 PARIGI
COP21 Paris Agreement and Climate News
- http://www.ansa.it/web/notizie/canali/energiaeambiente/isti tuzioni/2015/07/16/clima-galletti-martina-agricoltura- concorre-riduzione-co2 ca20781d-dc51-47d2-903d- 5255b8665e97.html
- http://www.repubblica.it/economia/2015/11/28/news/il clim a modificato nel 2050 rischia di costarci 100 miliardi di dollari | anno-128277026/?ref=nrct-8
- http://www.repubblica.it/ambiente/2015/11/30/news/al_via due_settimane_di_negoziati_tra_sostegno_ai_paesi_poveri e_tagli_alla_produzione_di_co2-128460854/?ref=nrct-448th IPCC report
IPCC Report and Global Warming
08/10/2018
- https://www.youtube.com/watch?v=12S3dKrx j7c&feature=youtu.be
https://www.ilfattoquotidiano.it/2018/10/08/riscaldamento-globale-rapporto-ipcc- se-non-freniamo-aumento-temperature-ancora-piu-tempeste-alluvioni-e- siccita/4678616/ https://www.theguardian.com/environment/2018/oct/08/global-warming-must- not-exceed-15c-warns-landmark-un-reportQual è il contributo in GHG della agricoltura Italiana?
Italian Agriculture's GHG Contribution
National Inventory Report 2019 (Ispra)
GHG Categories and Emissions (Gg CO2 equivalent)
GHG categories 1990 1995 2000 2005 2010 2015 2016 2017 Gg CO2 equivalent 1. Energy 425,233 439,358 459,095 479,675 418,615 352,832 350,284 345,852 2. Industrial Processes and Product Use 40,472 38,368 39,178 47,152 36,748 32,576 32,556 32,827 3. Agriculture 34,739 34,701 33,946 31,893 30,012 30,065 31,00 30,780 7.2% 4. LULUCF -3,283 -21,919 -16,229 -28,377 -34,674 -39,608 -36,558 -18,379 5. Waste 17,302 19,993 21,887 21,880 20,399 18,571 18,278 18,249 6. Other NO NO NO NO NO NO NO NO Ispra, 2019Agriculture sector include crops and animal production and it is the 2nd source with about 7% of total GHG emissions
Agriculture and Energy Sector GHG Emissions
Energy sector is the mainly with 86% of total GHG
GHG Categories and Emissions (Gg CO2 equivalent)
GHG categories 1990 base year 1995 2000 2005 2008 2009 2010 2011 2012 Gg CO2 equivalent 1. Energy 417,716 431,113 449,688 471,903 448,933 404,866 414,914 403,641 379,863 2. Industrial 38,390 35,937 36,101 42,339 35,317 30,348 31,265 31,049 28,201 Processes 3. Solvent and Other Product Use 2,455 2,235 2,301 2,123 1,947 1,818 1,669 1,648 1,516 4. Agriculture 40,830 40,602 40,218 37,442 36,091 34,852 33,783 33,572 34,289 5. LULUCF -3,609 -23,700 -16,974 -29,543 -25,817 -27,683 -31,119 -19,139 -18,556 6. Waste 19,665 20,445 22,929 20,454 18,331 18,229 17,728 16,691 16,214 7. Other NA NA NA NA NA NA NA NA NA 4. Agriculture 40,830 40,602 40,218 37,442 36,091 34,852 33,783 33,572 34,289 CH4: Enteric fermentation 12,278 12,348 12,246 10,914 10,996 11,007 10,732 10,753 10,667 Livestock Productions 50% CH .: Manure management 3,467 3,289 3,281 3,151 2,963 2,875 2,569 2,115 1,704 CH4: Rice Cultivation 1,576 1,671 1,391 1,472 1,386 1,565 1,565 1,550 1,533 CH4: Field Burning of Agricultural Residues 13 13 13 14 15 14 14 13 14 N2O: Manure management 3,934 3,791 3,871 3,717 3,781 3,818 3,706 3,713 3,742 NO: Agriculture soils 19,557 19,487 19,411 18,169 16,947 15,569 15,193 15,423 16,624 Crops Productions 50% N2O: Field Burning of Agricultural Residues 4 4 4 4 5 4 4 4 5
Can’t find what you’re looking for?
Explore more topics in the Algor library or create your own materials with AI.
