Principles of Vectorial Analysis of Electrocardiograms, Ceu Universidad Cardenal Herrera
Slides from Ceu Universidad Cardenal Herrera about Principles of Vectorial Analysis of Electrocardiograms. The Pdf provides a foundational understanding of ECG, detailing cardiac depolarization and potential projections in various leads for university students.
See more48 Pages


Unlock the full PDF for free
Sign up to get full access to the document and start transforming it with AI.
Preview
Principles of Vectorial Analysis of Electrocardiograms
Vectorial Analysis
- The heart current flows in a particular direction in the heart at a given instant during the cardiac cycle.
- A vector is an arrow that points in the direction of the electrical potential generated by the current flow, with the arrowhead in the positive direction.
- By convention, the length of the arrow is drawn proportional to the voltage of the potential.
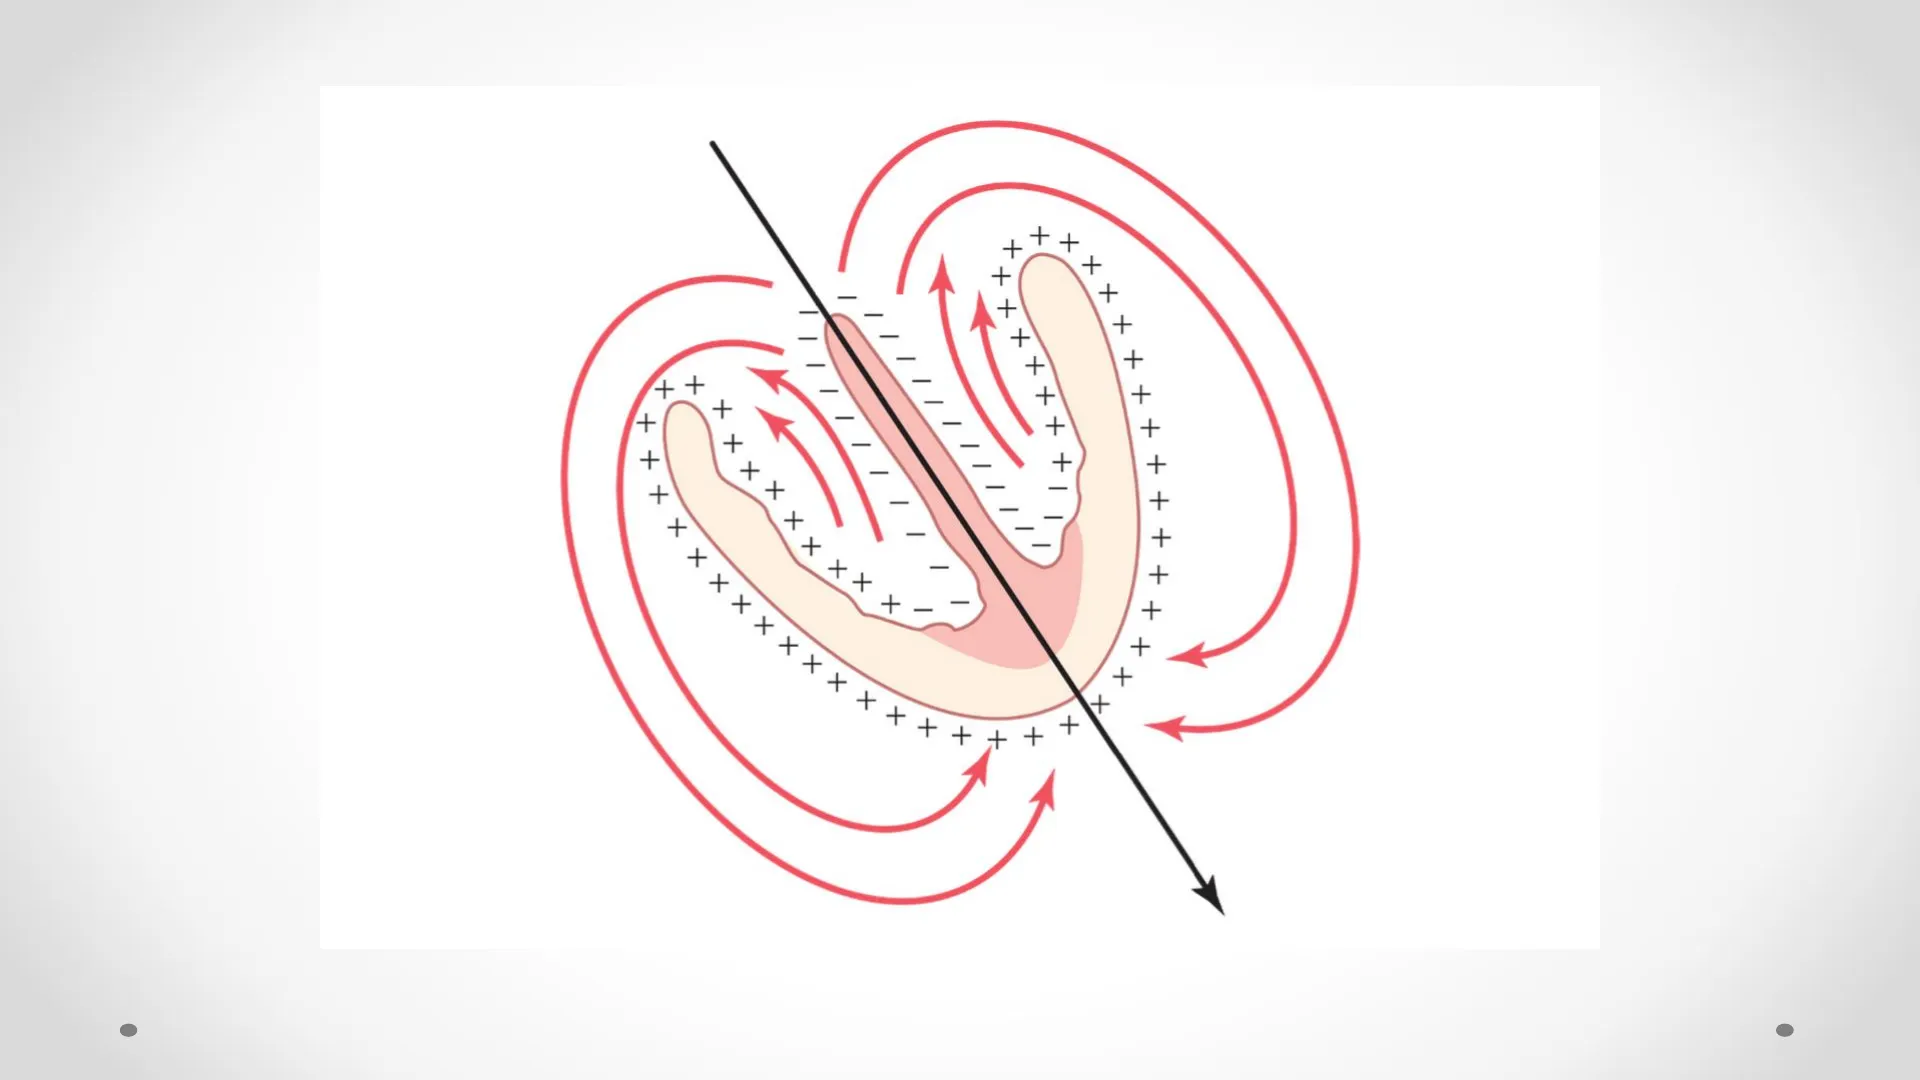
+ + + + + + + - + + + - + 1 1 1 + xxx - xx x - x × x + + + + + + x x x + + + + + + + + + + + - + x + + + + + + + 1"RESULTANT" VECTOR IN THE HEART AT ANY GIVEN INSTANT. + + + 1 + + + + - 1 + 1 + × 1 x xxx xxx + - - x x x X X + + + + + x x x x + + + + + + + + + + 1 + / + + + + + + + + 1"RESULTANT" VECTOR IN THE HEART AT ANY GIVEN INSTANT.
. At this instant of heart excitation, electrical current flows between the depolarized areas inside the heart and the nondepolarized areas on the outside of the heart, as indicated by the long elliptical arrows.
. Some current also flows inside the heart chambers directly from the depolarized areas toward the still polarized areas.
- Considerably more current flows downward from the base of the ventricles toward the apex than in the upward direction.
+ ++ xxx + + xx + + xxx / XX + + + - - + + + + + + + 1 + + + + + + + 1"RESULTANT" VECTOR IN THE HEART AT ANY GIVEN INSTANT.
. The summated vector of the generated potential at this particular instant, called the instantaneous mean vector, is represented by the long black arrow drawn through the center of the ventricles in a direction from base toward apex.
- Furthermore, because the summated current is considerable in quantity, the potential is large and the vector is long.
+ + + + + x ++ xx 1 xxx xx * + + + + + + + ++ +1, +++ ++++-90° +270° -100° - 0° 180° A 120° 59º +90°DIRECTION OF A VECTOR IS DENOTED IN TERMS OF DEGREES
- When a vector is exactly horizontal and directed toward the person's left side, the vector is said to extend in the direction of 0 degrees.
- From this zero reference point, the scale of vectors rotates clockwise: when the vector extends from above and straight downward, it has a direction of +90 degrees; when it extends from the person's left to right, it has a direction of +180 degrees; and when it extends straight upward, it has a direction of -90 (or +270) degrees.
-90° +270° -100° 180°- -0° A 120° 59º +90°DIRECTION OF A VECTOR IS DENOTED IN TERMS OF DEGREES
- In a normal heart, the average direction of the vector during spread of the depolarization wave through the ventricles, called the mean QRS vector, is about +59 degrees.
. This means that during most of the depolarization wave, the apex of the heart remains positive with respect to the base of the heart.
-90° +270° -100° 180°- -0° A 120° 59º +90°I - - aVF III aVR aVL + + 210° -30° I 0° I - + aVL aVR 60° - III 120° 90 + + + -AXIS FOR EACH STANDARD BIPOLAR & UNIPOLAR LIMB LEAD
. Each lead is actually a pair of electrodes connected to the body on opposite sides of the heart, and the direction from negative electrode to positive electrode is called the "axis" of the lead.
. Lead I is recorded from two electrodes placed respectively on the two arms. Because the electrodes lie exactly in the horizontal direction, with the positive electrode to the left, the axis of lead I is 0 degrees.
aVF - aVR aVL + + 210° -30° I 1 + aVR aVL 60° - 120° 90º + + +AXIS FOR EACH STANDARD BIPOLAR & UNIPOLAR LIMB LEAD
. In recording lead II, electrodes are placed on the right arm and left leg. The right arm connects to the torso in the upper right-hand corner and the left leg connects in the lower left-hand corner. The direction of this lead is about +60 degrees.
- Lead III has an axis of about +120 degrees.
- Lead aVR, +210 degrees.
- Lead aVF, +90 degrees.
- Lead aVL -30 degrees.
aVF - aVR aVL + + 210° -30° I 0° I - + aVR 60° 120° 90° + + + aVLAXIS FOR EACH STANDARD BIPOLAR & UNIPOLAR LIMB LEAD
. The directions of the axes of all these leads are shown in the hexagonal reference system.
- The polarities of the electrodes are shown by the plus and minus signs in the figure.
. You must learn these axes and their polarities, particularly for the bipolar limb leads I, II, and III, to understand the remainder.VECTORIAL ANALYSIS OF POTENTIALS IN DIFFERENT LEADS - B + AVECTORIAL ANALYSIS OF POTENTIALS IN DIFFERENT LEADS
- The figure shows a partially depolarized heart; vector A represents the instantaneous mean direction of current flow in the ventricles.
. In this instance, the direction of the vector is +55 degrees, and the voltage of the potential, represented by the length of vector A, is 2 mv.
- In the diagram below the heart, vector A is shown again, and a line is drawn to represent the axis of lead I in the 0-degree direction.VECTORIAL ANALYSIS OF POTENTIALS IN DIFFERENT LEADS
- To determine how much of the voltage in vector A will be recorded in lead I, a line perpendicular to the axis of lead I is drawn from the tip of vector A to the lead I axis, and a so-called projected vector (B) is drawn along the lead I axis.
- The arrow of this projected vector points toward the positive end of the lead I axis, which means that the record momentarily being recorded in the electrocardiogram of lead I is positive.
. And the instantaneous recorded voltage will be equal to the length of B.VECTORIAL ANALYSIS OF POTENTIALS IN DIFFERENT LEADS I B - + AVECTORIAL ANALYSIS OF POTENTIALS IN DIFFERENT LEADS
. In this example, vector A represents the electrical potential and its axis at a given instant during ventricular depolarization in a heart in which the left side of the heart depolarizes more rapidly than the right.
. In this instance, the instantaneous vector has a direction of 100 degrees, and its voltage is again 2 millivolts.
- To determine the potential actually recorded in lead I, we draw a perpendicular line from the tip of vector A to the lead I axis and find projected vector B.VECTORIAL ANALYSIS OF POTENTIALS IN DIFFERENT LEADS
- Vector B is very short and this time in the negative direction, indicating that at this particular instant, the recording in lead I will be negative, and the voltage recorded will be slight, about -0.3 millivolts.
- When the vector in the heart is in a direction almost perpendicular to the axis of the lead, the voltage recorded in the EKG of this lead is very low.
. When the heart vector has almost exactly the same axis as the lead axis, essentially the entire voltage of the vector will be recorded.VECTORIAL ANALYSIS OF POTENTIALS IN THE BIPOLAR LEADS. - - III I B I D + A C III + +VECTORIAL ANALYSIS OF POTENTIALS IN THE BIPOLAR LEADS.
. To determine the potential recorded at this instant in the EKG for each one of the three standard bipolar limb leads, perpendicular lines (the dashed lines) are drawn from the tip of vector A to the three lines representing the axes of the three different standard leads.
- The projected vector B depicts the potential recorded at that instant in lead I, projected vector C depicts the potential in lead II, and projected vector D depicts the potential in lead III.VECTORIAL ANALYSIS OF POTENTIALS IN THE BIPOLAR LEADS.
- In each of these, the record in the EKG is positive-that is, above the zero line-because the projected vectors point in the positive directions along the axes of all the leads.
- The potential in lead I (vector B) is about one-half that of the actual potential in the heart (vector A); in lead II (vector C), it is almost equal to that in the heart; and in lead III (vector D), it is about one-third that in the heart. WHY?VECTORIAL ANALYSIS OF THE NORMAL ELECTROCARDIOGRAM
- When the cardiac impulse enters the ventricles through the atrioventricular bundle, the first part of the ventricles to become depolarized is the left endocardial surface of the septum.
- Then depolarization spreads rapidly to involve both endocardial surfaces of the septum.
- Next, depolarization spreads along the endocardial surfaces of the remainder of the two ventricles.
. Finally, it spreads through the ventricular muscle to the outside of the heart.VECTORIAL ANALYSIS OF THE NORMAL ELECTROCARDIOGRAM 1 1 1 1 1 1 Į III + + 1 A B = = 1 1 1 + = = III II + C D = I 1 1 E 1 1 1 = +VECTORIAL ANALYSIS OF THE NORMAL ELECTROCARDIOGRAM
- At each stage, the instantaneous mean electrical potential of the ventricles is represented by a red vector superimposed on the ventricle in each figure.
- Each of these vectors is then analyzed determine the voltages that will be recorded at each instant in each of the three standard electrocardiogra leads.
- Keep in mind that a positive vector in a lead will cause recording in the EKG above the zero line, whereas a negative vector will cause recording below the zero line.VECTORIAL ANALYSIS OF THE NORMAL ELECTROCARDIOGRAM I + i I + + AVECTORIAL ANALYSIS OF THE NORMAL ELECTROCARDIOGRAM
- The ventricular muscle has just begun to be depolarized, representing an instant about 0.01 second after the onset of depolarization.
. The vector is short because only a small portion of the ventricles-the septum- is depolarized.
. Therefore, all EKG voltages are low, as recorded to the right of the ventricular muscle for each of the leads.
. The voltage in lead II is greater than the voltages in leads I and III because the heart vector extends mainly in the same direction as the axis of lead II.VECTORIAL ANALYSIS OF THE NORMAL ELECTROCARDIOGRAM X III 1 I I + + III BVECTORIAL ANALYSIS OF THE NORMAL ELECTROCARDIOGRAM
- Figure B which represents about 0.02 second after onset of depolarization.
. The heart vector is long because much of the ventricular muscle mass has become depolarized.
. Therefore, the voltages in all electrocardiograma have increased.VECTORIAL ANALYSIS OF THE NORMAL ELECTROCARDIOGRAM I I I + III + III CVECTORIAL ANALYSIS OF THE NORMAL ELECTROCARDIOGRAM
- About 0.035 s after onset of depolarization, the heart vector is becoming shorter and the recorded EKG voltages are lower because the outside of the heart apex is now electronegative, neutralizing much of the positivity on the other epicardial surfaces of the heart.
- The axis of the vector is beginning to shift toward the left side of the chest because the left ventricle is slightly slower to depolarize than the right.
. Therefore, the ratio of the voltage in lead I to that in lead III is increasing.
Can’t find what you’re looking for?
Explore more topics in the Algor library or create your own materials with AI.
