Separating specific proteins: chromatography methods and applications
Slides about separating specific proteins using chromatography. The Pdf describes ion-exchange, gel-filtration, and affinity chromatography methods, explaining their principles and applications. This University-level Biology material, presented as a detailed outline, includes diagrams to visualize the separation processes.
See more55 Pages

Unlock the full PDF for free
Sign up to get full access to the document and start transforming it with AI.
Preview
Protein Separation and Detection
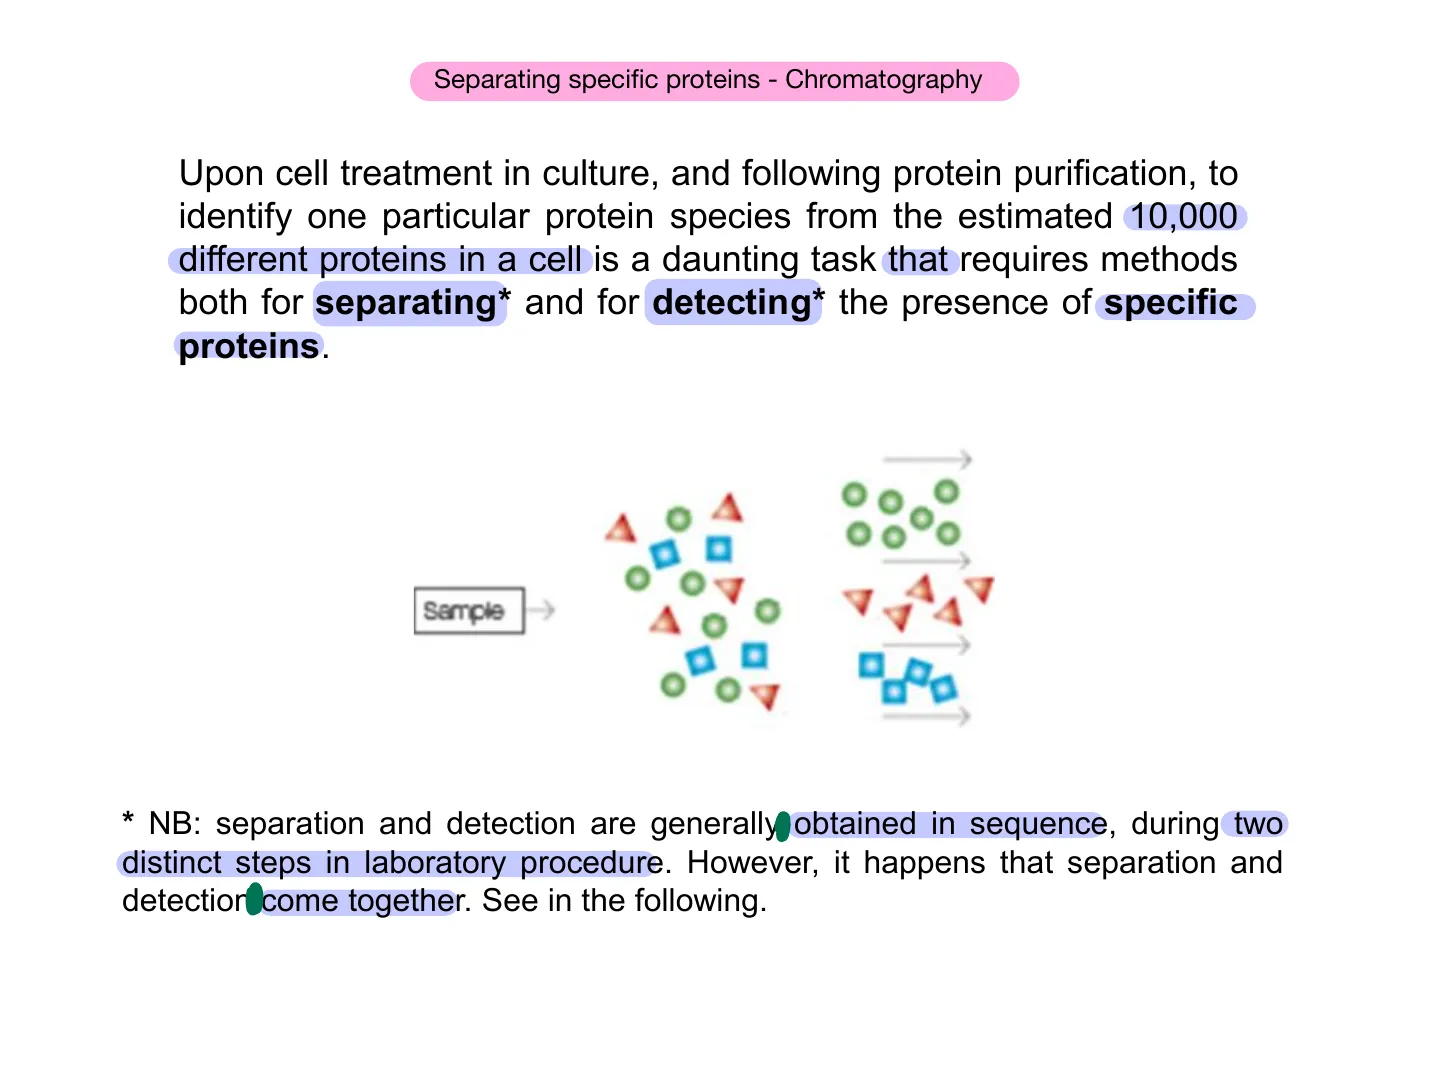
Upon cell treatment in culture, and following protein purification, to identify one particular protein species from the estimated 10,000 different proteins in a cell is a daunting task that requires methods both for separating* and for detecting* the presence of specific proteins. Semple * NB: separation and detection are generally obtained in sequence, during two distinct steps in laboratory procedure. However, it happens that separation and detection come together. See in the following.
Liquid Chromatography Principles
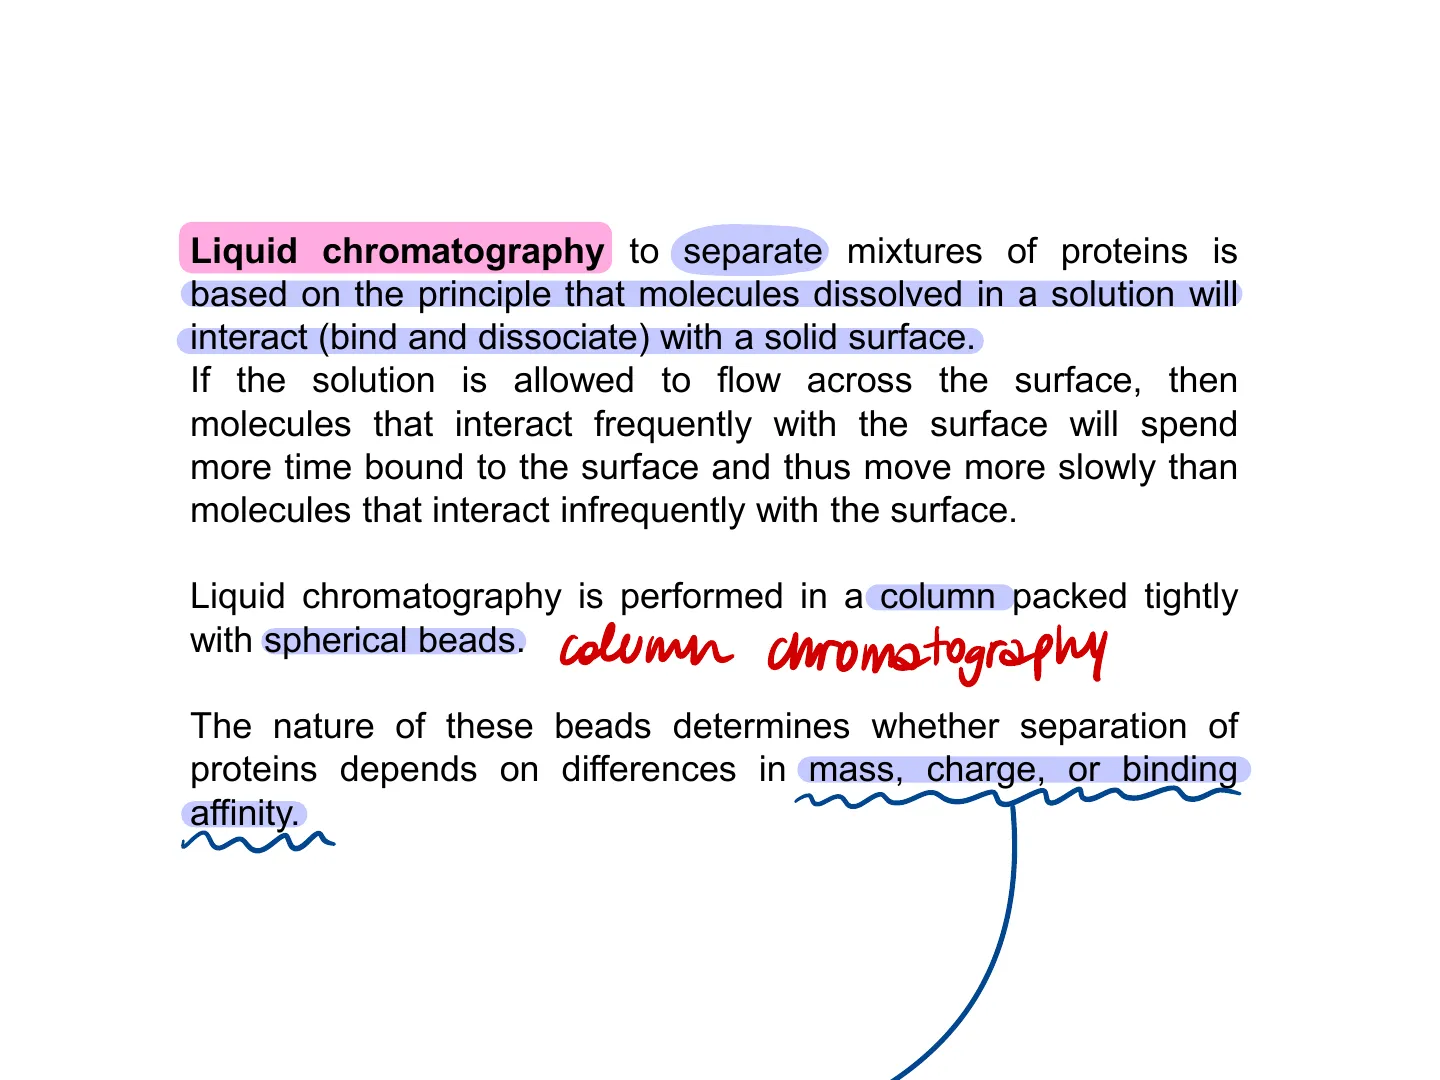
Liquid chromatography to separate mixtures of proteins is based on the principle that molecules dissolved in a solution will interact (bind and dissociate) with a solid surface. If the solution is allowed to flow across the surface, then molecules that interact frequently with the surface will spend more time bound to the surface and thus move more slowly than molecules that interact infrequently with the surface. Liquid chromatography is performed in a column packed tightly with spherical beads.
Column Chromatography for Protein Fractionation
column chromatography The nature of these beads determines whether separation of proteins depends on differences in mass, charge, or binding affinity.Proteins can be fractionated by column chromatography, in which a mixture of proteins in solution is passed through a column containing a porous solid matrix. Different proteins are retarded to different extents by their interaction with the matrix, and they can be collected separately as they flow out of the bottom of the column. Depending on the choice of matrix, proteins can be separated according to their charge ion-exchange chromatography), their size & (gel-filtration chromatography), or their ability to bind to particular small molecules or to other macro-molecules (affinity chromatography). C
Column Chromatography Process
Initial Sample Application
COLUMN CHROMATOGRAPHY solvent continuously applied to the top of column from a large reservoir of solvent sample applied solid matrix 0 0 0 0 porous plug timeMobile phase enters the column from the top, passes through the particle bed, and exits at the bottom. The image at the left represents the column at time zero (the moment of injection), when the sample enters the column and begins to form a band. The sample shown here, a mixture of red and green dyes, appears at the inlet of the column as a single black band. In reality, the sample could be anything that can be dissolved in a solvent; typically the compounds would be colorless and the column wall opaque, so we would need a detector to see the separated compounds as they elute. moment of 1 infection sample applied solvent continuously applied to the top of column from a large reservoir of solvent solid matrix 0 0 0 0 porous plug time
Dye Separation in Column
solvent continuously applied to the top of column from a large reservoir of solvent sample applied solid matrix 0 0 0 0 6 porous plug time After a few minutes, during which mobile phase flows continuously and steadily past the packing material particles, we can see that the individual dyes have moved in separate bands at different speeds. This is because there is a competition between the mobile phase and the stationary phase for attracting each of the dyes or analytes. Notice that the red dye band moves the fastest and is about to exit the column. The red dye likes (is attracted to) the mobile phase more than the other dyes. Therefore, it moves at a faster speed, closer to that of the mobile phase. The green dye band likes the packing material more than the mobile phase. Its stronger attraction to the particles causes it to move significantly slower. In other words, it is the most retained compound in this sample mixture. Since each dye band moves at different speed, we are able to separate it chromatographically.A
Ion-Exchange Chromatography
Ion-exchange columns are packed with small beads that carry either a positive or a negative charge, so that proteins are fractionated according to the arrangement of charges on their surface. solvent flow positively charged + + bead + bound negatively charged molecule free positively charged molecule ION-EXCHANGE CHROMATOGRAPHYB
Gel-Filtration Chromatography
Gel-filtration columns, which separate proteins according to their size, are packed with tiny porous beads: molecules that are small enough to enter the pores linger inside successive beads as they pass down the column, while larger molecules remain in the solution flowing between the beads and therefore move more rapidly, emerging from the column first. Besides providing a means of separating molecules, gel-filtration chromatography is a convenient way to estimate their size. solvent flow 1 1 porous bead retarded small molecule unretarded large molecule GEL-FILTRATION CHROMATOGRAPHY
Affinity Chromatography
Affinity chromatography takes advantage of the biologically important binding interactions that occur at protein surfaces. If a substrate molecule is covalently coupled to an inert matrix such as a polysaccharide bead, the enzyme that operates on that substrate will often be specifically retained by the matrix and can then be eluted (washed out) in nearly pure form. trattenuto Specific antibodies* can be coupled to a matrix to purify protein molecules recognized by the antibodies. Because of the great specificity of all such affinity columns, 1000- to 10,000-fold purifications can sometimes be achieved in a single pass. solvent flow 1 Į C C bead with covalently attached substrate I bound enzyme molecule other proteins AFFINITY CHROMATOGRAPHY *See the specific slide presentation
Fraction Collection in Chromatography
Fraction collection allows single molecular species in a chromatogram to be isolated. Nearly all of the modes of chromatography are amenable to fraction collection. Suscettibile Sample Mobile Phase 0 0 3 Further Separation Molecules Separate T A First molecule comes off Fraction Fraction with first molecule Fraction without molecules Second molecules comes off
High Performance Liquid Chromatography (HPLC)
HPLC System Components
High Performance Liquid Chromatography * La fase mobile esce dal rilevatore e può essere inviata ai rifiuti, o raccolta, come desiderato. Quando la fase mobile contiene una banda composta separata, HPLC fornisce la capacità di raccogliere questa frazione dell'eluato contenente quel composto purificato per ulteriori studi. Questa è chiamata cromatografia preparatoria. I tubi e i raccordi ad alta pressione vengono utilizzati per interconnettere i componenti della pompa, dell'iniettore, della colonna e del rilevatore per formare il condotto per la fase mobile, il campione e le bande composte separate. HPLC Column Packing Materail Chromatogram Peaks - Yellow, Red, Blue Injector AutoSampler Sample Manager Computer Data Station Solvent (Mobile Phase) Reservoir Sample Detector Pump Solvent Manager Solvent Delivery System Waste A reservoir holds the solvent, called the mobile phase, because it moves. A high-pressure pump (solvent delivery system or solvent manager) generates and meters a specified flow rate of mobile phase (mL/min). An injector (sample manager or autosampler) injects the sample into the continuously flowing mobile phase stream that carries the sample into the HPLC column. The column contains the chromatographic packing material needed to effect the separation. This packing material is called the stationary phase because it is held in place by the column hardware, A detector is needed to see the separated ompound bands as they elute from the HPLC column. Note that most compounds have no color, so cannot benn seen by eye .* The mobile phase exits the detector and can be sent to waste, or collected, as desired. When the mobile phase contains a separated compound band, HPLC provides the ability to collect this fraction of the eluate containing that purified compound for further study. This is called preparative chromatography. High-pressure tubing and fittings are used to interconnect the pump, injector, column, and detector components to form the conduit for the mobile phase, sample, and separated compound bands.
HPLC Detection and Data Analysis
High Performance Liquid Chromatography The detector is wired to a computer data station, the HPLC system component that records the electrical signal needed to generate the chromatogram on its display and to identify and quantitate the concentration of the sample constituents. Since sample compound characteristics can be very different, several types of detectors have been developed. For example, if a compound can absorb ultraviolet light, a UV- absorbance detector is used. If the compound fluoresces, a fluorescence detector is used. The most powerful approach is the use multiple detectors in series. Fluorescence Detector Column Chamber Chromatogram ------ Sample Manager Solvent Manager
Chromatogram Generation and Interpretation
Injected Sample Band (Appears "Black") (Blue, Red, Yellow) Time Zero Mobile Phase Analyte Bands Time +10 Minutes Mobile Phase Detector Flow Cell HPLC Column NB: operating pressure limits for regular HPLC systems are in the range 400 : 500 bar ... Injection Start Base-lineDetector Flow Cell HPLC Column chromatogram Injection Start Base-line PC data station In this figure, the yellow band has passed through the detector flow cell and the electrical signal (chromatogram) generated has been sent to the PC data station. Note that the chromatogram begins when the sample was first injected and starts as a straight line set near the bottom of the screen. This is called the baseline; it represents pure mobile phase passing through the flow cell over time. As the yellow analyte band passes through the flow cell, a stronger signal is sent to the computer. The line curves, first upward, and then downward, in proportion to the concentration of the yellow dye in the sample band. This creates a peak in the chromatogram. After the yellow band passes completely out of the detector cell, the signal level returns to the baseline; the flow cell now has, once again, only pure mobile phase in it. Since the yellow band moves fastest, eluting first from the column, it is the first peak drawn. A little while later, the red band reaches the flow cell. The signal rises up from the baseline as the red band first enters the cell, and the peak representing the red band begins to be drawn, etc. etc.
Can’t find what you’re looking for?
Explore more topics in the Algor library or create your own materials with AI.
