Rilevazione e quantificazione di una proteina specifica
Slide di Biologia sulla rilevazione della presenza di una proteina specifica. Il Pdf, utile per l'Università, esplora le tecniche di saggio proteico e il processo di purificazione analitica, confrontando l'analisi proteica con quella dell'mRNA.
Mostra di più20 pagine

Visualizza gratis il Pdf completo
Registrati per accedere all’intero documento e trasformarlo con l’AI.
Anteprima
Rilevazione e Quantificazione delle Proteine
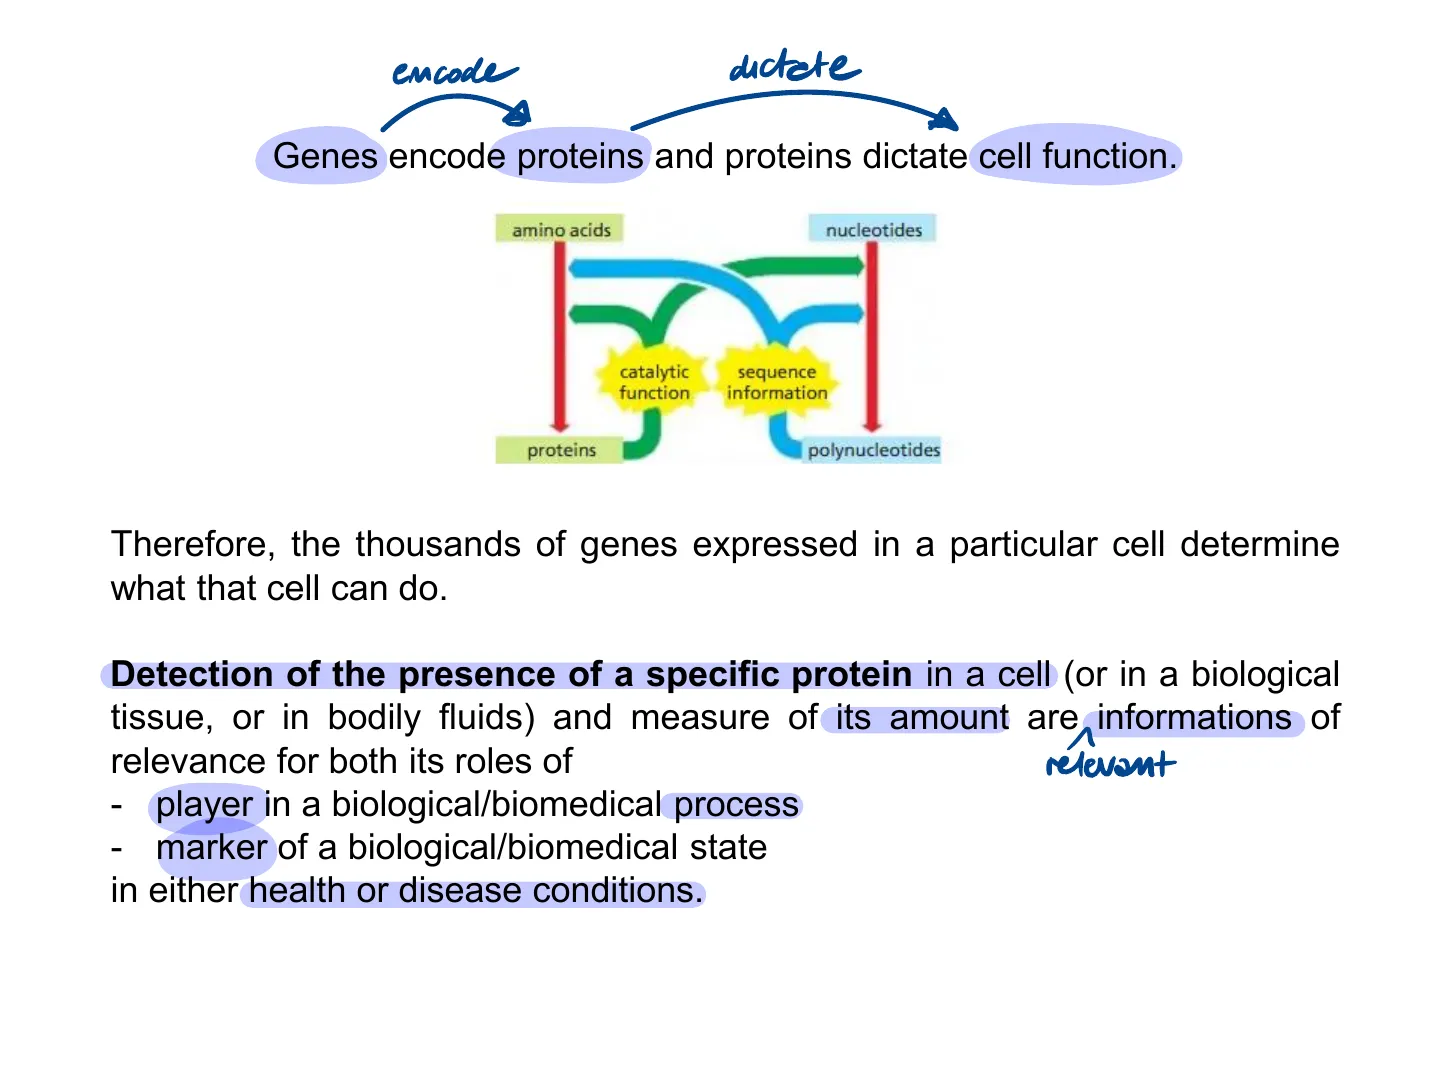
Detection of the presence of a specific protein in a cell (or in a biological tissue, or in bodily fluids) and measure of its amount are informations of relevance for both its roles of relevant
- player in a biological/biomedical process
- marker of a biological/biomedical state
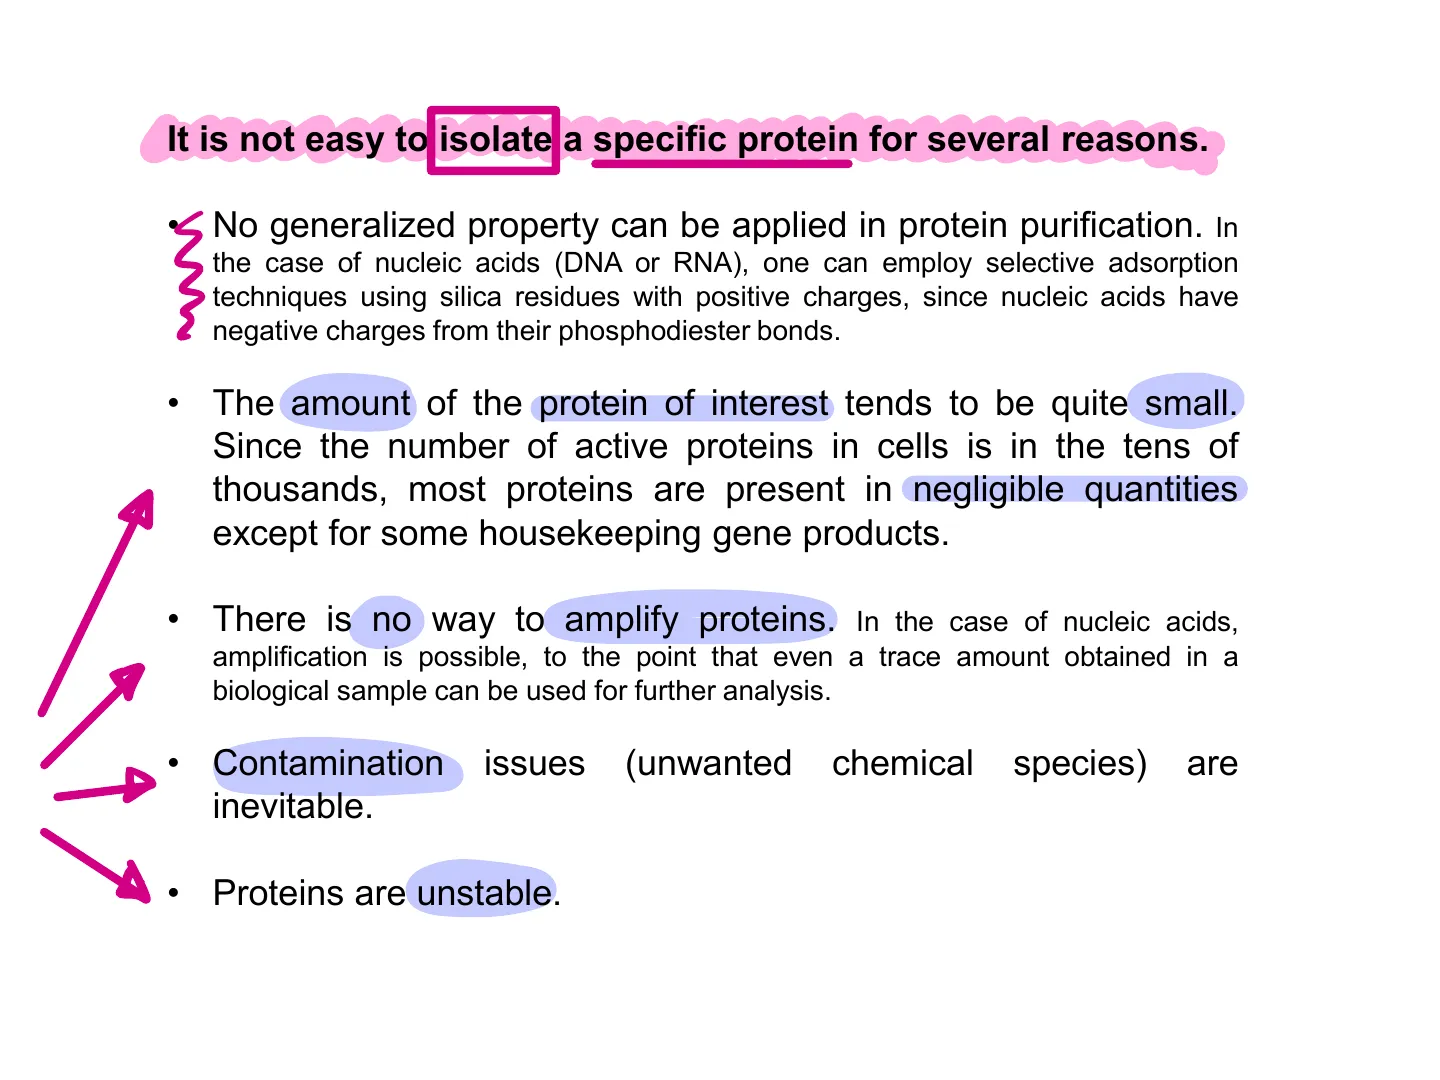
in either health or disease conditions.It is not easy to isolate a specific protein for several reasons.
-
• No generalized property can be applied in protein purification. In the case of nucleic acids (DNA or RNA), one can employ selective adsorption techniques using silica residues with positive charges, since nucleic acids have negative charges from their phosphodiester bonds.
-
The amount of the protein of interest tends to be quite small. Since the number of active proteins in cells is in the tens of thousands, most proteins are present in negligible quantities except for some housekeeping gene products.
-
There is no way to amplify proteins. In the case of nucleic acids, amplification is possible, to the point that even a trace amount obtained in a biological sample can be used for further analysis.
-
• Contamination issues (unwanted chemical species) are inevitable.
-
• Proteins are unstable.Technology for quantifying protein abundance was introduced almost thirty years ago and there has recently been a significant increase in the development of new tools.
Concurrently, tools for analyzing mRNA expression are becoming more mainstream.
However, the quantification of both of these molecular populations is not an exercise in redundancy.
The assumption is often made that transcript expression levels correspond to protein levels in a meaningful way.
gene A gene B gene A gene B gene A gene B DNA TRANSCRIPTION TRANSCRIPTION RNA RNA RNA RNA RNA RNA TRANSLATION TRANSLATION TRANSLATION TRANSLATION A A A A A TRANSLATION A A A A A TRANSLATION A A A A A B B B R A A A A A A A A A A B B B B R A A A A A B B B B B B B B B B
However, the strength of the overall correlation between transcript and protein expression is often inconsistent.
gene A gene B gene A gene B DNA TRANSCRIPTION TRANSCRIPTION TRANSCRIPTION TRANSCRIPTION RNA RNA TRANSLATION TRANSLATION A A A A A B B B B B A A A A A A A A A A A A A A A A A A A A A A A A A AAAA A gene A gene B DNA TRANSCRIPTION TRANSCRIPTION RNA RNA RNA RNA TRANSLATION TRANSLATION A A A B A A A A A B B B B B A A A A A B B B B B A A A A A A A A A A B AA A A A B DNA DNA TRANSCRIPTION TRANSCRIPTION TRANSCRIPTION TRANSCRIPTION - B B B A A A A A AAAAA DNA TRANSLATION TRANSLATION AIn short, thanks to the amplification power of PCR-based protocols, assaying nucleic acid sequences (namely mRNAs) is easier, cheaper, faster than measuring their cognate proteins. Sometimes this the only available approach, given that the available levels of a specific recoverable protein might be below the analytical threshold of a given method.
However, investigating at the protein level is important in various applications such as drug discovery and development, as well as a disease diagnosis.
CELL-BASED DISEASE MODELS EXPRESSION PROFILE BIOMARKERS FUNCTIONAL ANALYSISAn analytical measurement procedure produces a detectable signal for quantifying and measuring biological processes.
Protein assays are the techniques used to study proteins such as for detecting and quantifying proteins.
The quantitation of protein concentration is an essential part of any biochemical laboratory workflow.
Knowing the concentration of proteins helps researchers compare results across various experiments. Moreover, it is helpful in verifying the success of the lysis step determining a protein yield, and normalizing multiple samples for comparison.
Purificazione Analitica delle Proteine
Analytical purification produces a relatively small amount of a protein for a variety of research or analytical purposes, including identification and quantification.
If the protein of interest is not secreted by the organism into the surrounding solution, the first step of each purification process is the disruption of the cells containing the protein, using methods such as repeated freezing and thawing, grinding, ultrasounds and permeabilization by detergents.
Finally, the cell debris can be removed by centrifugation so that the proteins and other soluble compounds remain in the supernatant.
matena e che secimenta rotore vusto SUPERNATANT cell homogenate PELLET mitochondria lysosomes peroxisomes whole cells nuclei cytoskeletons*UV/Vis Spectroscopy* and *Bradford Protein Assay* are *2 separate methods* used to measure the *concentration of proteins* in a sample.
Spettroscopia UV/Vis
-
* UV/Vis Spectroscopy* - * Principle *: Based on the ability of proteins to *absorb light* in the ultraviolet (UV) or visible region of the electromagnetic spectrum. Proteins, particularly amino acids like *tryptophan* and *tyrosine*, absorb light around *280 nm *.
- * Method *: Protein concentration is determined by measuring the intensity of light absorbed by the sample at a specific wavelength, and using *Beer-Lambert Law* to calculate the concentration.
- * Pro *: It is a *direct method* that does not require specific reagents, but it requires sufficient protein levels and minimal interference from other substances.
Legge di Beer-Lambert
*Beer-Lambert Law* - * Principle *: The law describes the relationship between the *concentration of a substance* (in this case, proteins) and the *amount of light passing through the sample *.
A = E· c · 1
Where: - A is absorbance (optical density), - E is the molar extinction coefficient (specific to each substance), - c is the concentration of the substance, - I is the path length (thickness of the sample).
- * Method *: Mainly used in *UV/Vis spectroscopy *. By measuring absorbance, you can calculate the protein concentration if you know the molar extinction coefficient.
Bradford Protein Assay
-
* Bradford Protein Assay* - * Principle *: A *colorimetric assay* based on the reaction between proteins and a dye called *Coomassie Brilliant Blue *. When the dye binds to proteins, it changes color from brown to blue. The amount of *blue color* is proportional to the *amount of protein* present.
- * Method *: Protein concentration is determined by measuring the intensity of the color (absorbance) at *595 nm* using a spectrophotometer. The relationship between absorbance and protein concentration is determined through a *calibration curve *.
- * Pro *: It is more sensitive and suitable for samples with low protein concentrations compared to the direct UV/Vis method.
Differenze tra Metodi di Quantificazione Proteica
*Main differences between the methods *: 1. * UV/Vis Spectroscopy* is a *direct method* that relies on light absorption by proteins at 280 nm. 2. * Beer-Lambert Law* is a principle that applies when using UV/Vis spectroscopy to determine the concentration of a substance (including protein), so it *supports* UV/Vis spectroscopy. 3. The *Bradford Protein Assay* is a *colorimetric method* that involves a chemical reaction between the dye and proteins, which is then measured using a spectrophotometer.
*In summary *: - * UV/Vis Spectroscopy* and *Beer-Lambert Law* are often used together to determine protein concentration by measuring light absorption at 280 nm, whereas the *Bradford Assay* is a separate test that uses a dye to produce a measurable signal to determine protein concentration.ELISA and Lateral Flow Immunoassay are used for DETECTION and SEMI QUANTIFICATION . Western Blotting method is used for DETECTION and QUANTIFICATION. Bradford Protein Assay and UV/vis spectroscopy are used for QUANTIFICATION. Quantification of total protein concentration in a sample is an essential step prior to protein-based assays, during a gene expression analysis.
A traditional method for assessing protein concentration is UV/vis spectroscopy.
The spectrum of electromagnetic radiation organised by increasing wavelength, and thus decreasing energy, from left to right.
UV/Vis regions of the electromagnetic spectrum and their associated techniques are widely used for analytical work and research into biological problems.
Radiazione Elettromagnetica e Spettroscopia
Light is electromagnetic radiation and can be described as a wave propagating transversally in space and time. The electric (E ) and magnetic (M) field vectors are directed perpendicular to each other. For UV/vis spectroscopy, the electric field vector E is of most importance.
Wavelength M vectors E vectors Direction of propagation
From: Principles and techniques of biochemistry and molecular biology. K. Wilson and J. Walker eds. - 8th ed. - Cambridge University Press
Wavelength M vectors E vectors Direction of
From: Principles and techniques of biochemistry and molecular biology. K. Wilson and J. Walker eds. - 7th ed. - Cambridge University Press
Wavelenght (2) is the distance between a part of a wave of energy, such as light, and the next similar part. Wavelength can be measured in meters, centimeters, or nanometers (1 m = 109 nm).
The frequency (v) of a wave is the number of waves passing a point in a certain time. We normally use a time of one second, so this gives frequency the unit hertz (Hz), since one hertz is equal to one wave per second.
V= c 1-1 c = light speed (2.998 x 10⁸ m s-1)Proteins strongly absorb UV light with wavelengths of 280 nm due to the resonance structure of aromatic amino acid residues.
Protein Absorption Nucleic Acid T 240 260 280 300 320 wavelength (nm)Amino acid residues that are primarily responsible for the inherent light absorption of proteins are tryptophan and tyrosine (phenylalanine to some limited extent).
COO +HẸN-C-H CH CH C-CH NH OH Tyrosine (Tyr or Y) Tryptophan (Trp or W) 6 Tryptophan 5 4 Absorbance 3 2 Tyrosine 1 0 230 240 250 260 270 280 290 300 310 Wavelength (nm)Direct measurements of protein samples at OD280 can be converted to concentration using the Beer-Lambert law which relates absorbance to concentration using the pathlength of the measurement and an extinction coefficient. Where A = absorbance, £ = molar extinction coefficient, c = concentration (in the units corresponding to &) and I = light pathlength. Given this equation, concentration can be calculated.
Non hai trovato quello che cercavi?
Esplora altri argomenti nella Algor library o crea direttamente i tuoi materiali con l’AI.
