Lecture 11: Electrocardiogram in cardiovascular physiology
Slides about Lecture 11: Electrocardiogram. The Pdf, a presentation for University Biology students, focuses on the electrocardiogram (ECG), its normal components, heart rate calculation, and various pathological conditions like arrhythmias and heart blocks.
See more8 Pages

Unlock the full PDF for free
Sign up to get full access to the document and start transforming it with AI.
Preview
Cardiovascular Physiology: Electrocardiogram
Learning Objectives
- Characterize EKG of normal states.
- Calculate heart rate from an EKG.
- Characterize EKG of pathological states.
Characterizing ECG of Normal States
The electrocardiogram (ECG) is a measurement of the electrical activity of the heart recorded from the surface of the body; it provides information about the heart rate, the conduction of excitation between parts of the heart, the orientation of the heart in the chest, the size of heart chambers, and whether the ventricle has been damaged.
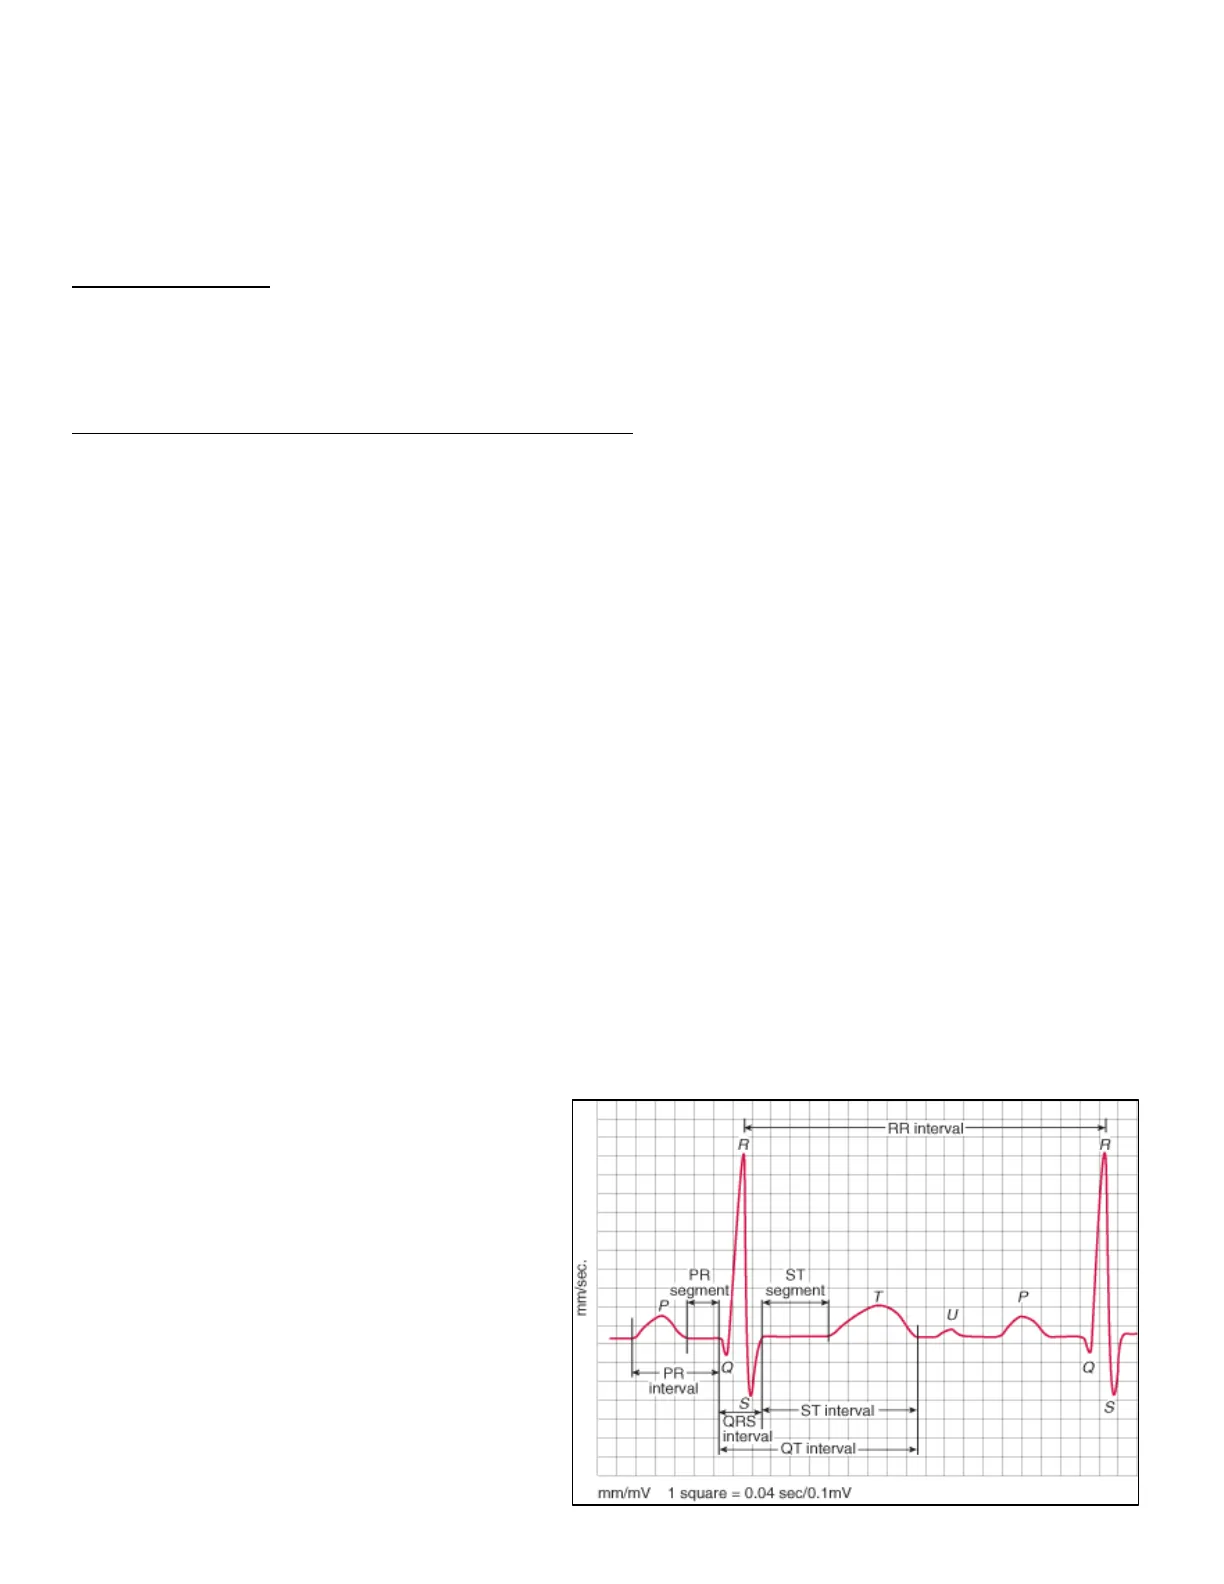
The components of the ECG include (Fig 1,2): P-wave - SA node fires > depolarization spreads throughout the atria PR-interval - conduction from SA-node to the AV-node PR-segment - the atria is completely depolarized, there is no charge difference between electrodes so the voltage is zero (isoelectric) QRS-complex - AV node depolarized > beginning of ventricular depolarization ST-segment - period when the ventricle is completely depolarized; because the ventricle is completely depolarized, there is no charge difference between electrodes so the voltage is zero (isoelectric) QT-interval - time from beginning of ventricular depolarization through the end of ventricular repolarization (ventricular systole) T-wave - ventricular repolarization R-R interval - used to calculate heart rate
RR interval R R mm/sec. PR ST segment segment T P U 10 Q -PR- interval ST interval S ORS interval QT interval mm/mV 1 square = 0.04 sec/0.1mV Fig 1LECTURE 11: ELECTROCARDIOGRAM
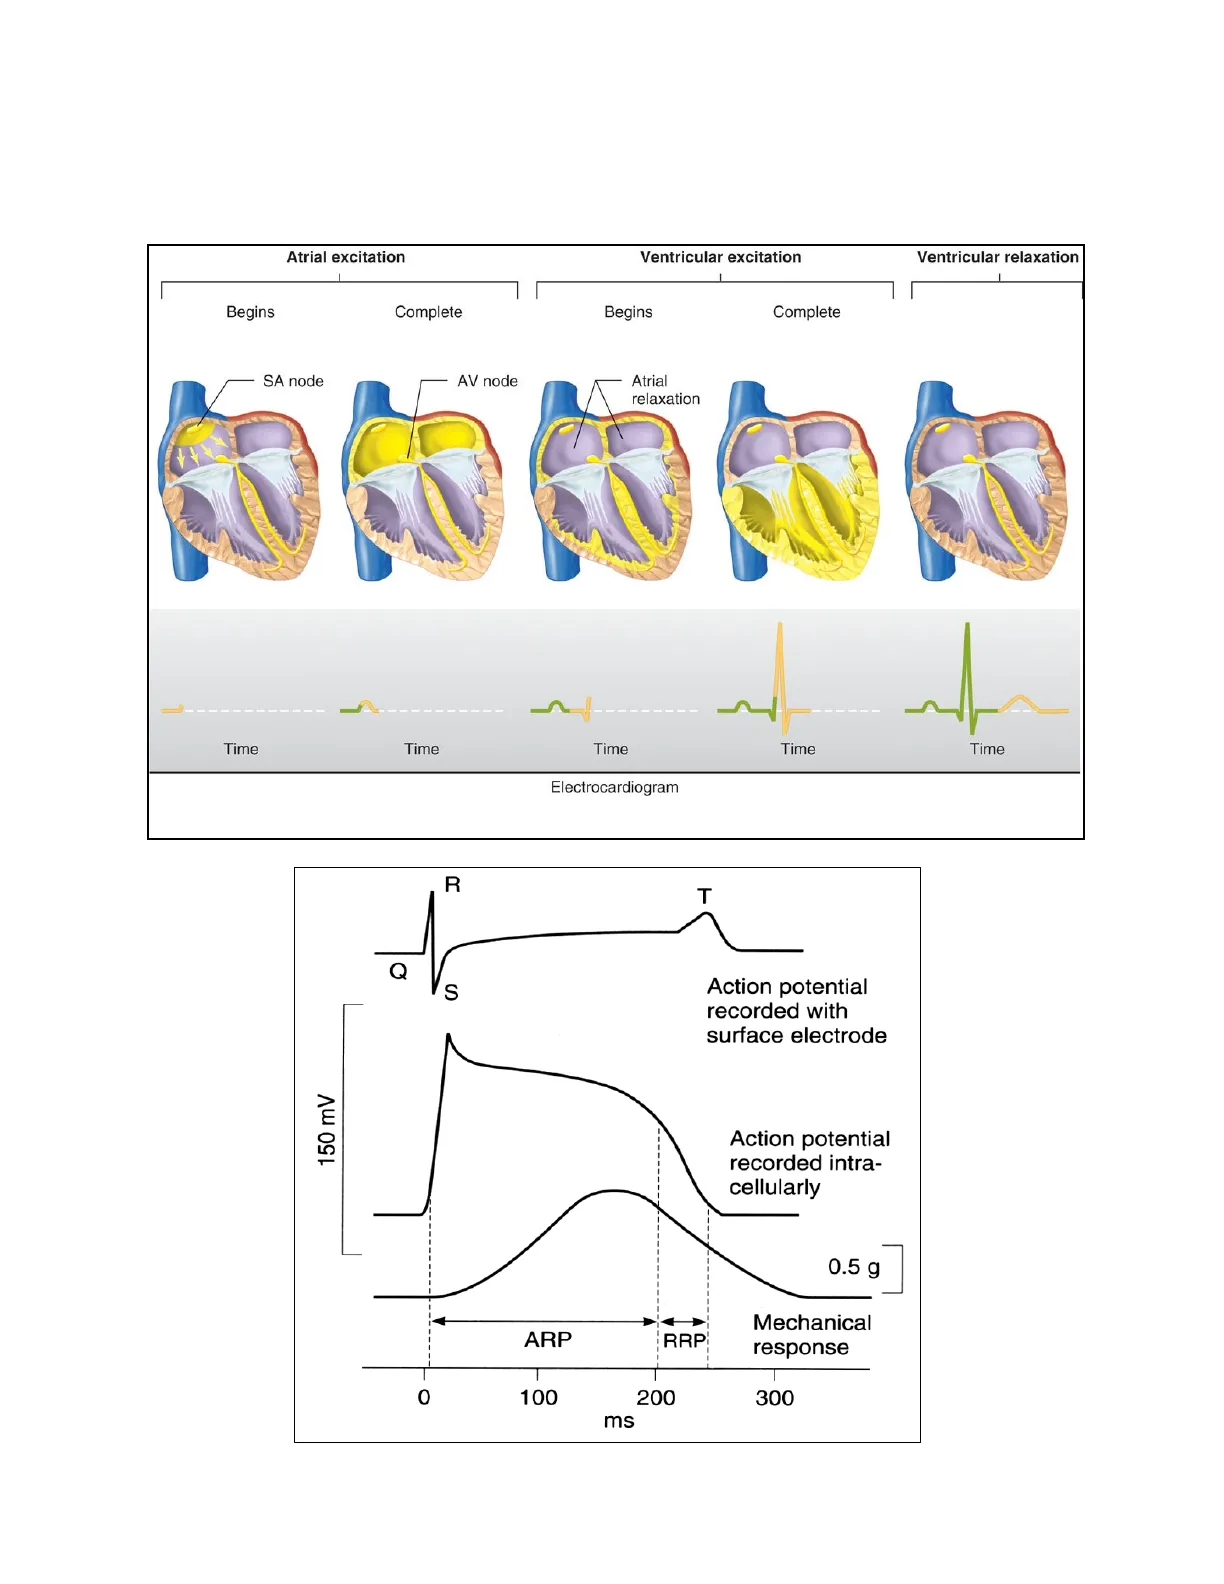
Upon overlaying the ECG with the fast response ventricular action potential (Fig 3), the QRS complex corresponds to Phase 0 of the action potential. The ST segment corresponds to Phase 2 of the action potential. The T wave corresponds to Phase 3 of the action potential.
Atrial excitation Ventricular excitation Ventricular relaxation Begins Complete Begins Complete SA node AV node Atrial relaxation 1 ----- Time Time Time Time Time Electrocardiogram Fig 2 R T Fig 3 Q S Action potential recorded with surface electrode 150 mV Action potential recorded intra- cellularly 0.5 g ARP RRP Mechanical response 0 100 200 300 msLECTURE 11: ELECTROCARDIOGRAM
Calculating Heart Rate from an ECG
On the horizontal (time-axis) of an ECG trace (Fig 4), the width of each large block represents 0.2 seconds. Count the number of large blocks between two successive R- waves, multiple by 0.2 and divide into 60. The resulting number is the heart rate in beats/minute. For the image below, there are ~5 large blocks between the two R- waves. This represents 1-second (0.2 x 5). 5 large squares = 1 s Fig 4 1 large square = 0.2 s 1 small square = 0.04 s
The normal resting heart rate is between 60 and 100 bpm.
A quick method is to remember the value of a few key intervals (Fig 5). When you do the math, if two R-waves are: One large block apart = 300 bpm Two large blocks apart = 150 bpm Three large blocks apart = 100 bpm Four large blocks apart = 75 bpm Five large blocks apart = 60 bpm
300 100 60 Start 150 75 50 here Fig 5 LECTURE 11: ELECTROCARDIOGRAM
Characterizing Pathological States in ECG
ECGs are used to non-invasively help diagnose heart conditions.
Normal Sinus Rhythm
Normal (Fig 6) - all components of the ECG present and in correct sequence; heart rate ranges 60-100 bpm. NORMAL SINUS RHYTHM Impulses originate at S-A node at normal rate Fig 6 S-A node 1 T 1 mV 1.0 s All complexes normal, evenly spaced. Rate 60 - 100/min.LECTURE 11: ELECTROCARDIOGRAM
Sinus Tachycardia
Sinus tachycardia (Fig 7) - heart rate is greater than 100 beats/min due to rapid firing of the SA node. SINUS TACHYCARDIA Impulses originate at S-A node at rapid rate Fig 7 1 All complexes normal, evenly spaced. Rate >100/min.
Atrioventricular Nodal Reentrant Tachycardia (AVNRT)
Atrioventricular Nodal Reentrant Tachycardia (AVNRT) (Fig 8) - a type of supraventricular tachycardia (SVT). The cause is an abnormal re-entry circuit at the AV node (Fig 9) causing absent P waves.
Atrium Atrium Reentry circuit AV node AV bode Słow pathway Fast pathway His Bundle His Bundle Ventricles Ventricles Fig 9 Fig 8LECTURE 11: ELECTROCARDIOGRAM
Wolff-Parkinson-White (WPW) Syndrome
Wolff-Parkinson-White (WPW) Syndrome (Fig 10) - type of supraventricular tachycardia (SVT). Caused by extra electrical pathways in the heart called the bundle of Kent. Delta waves appear in an EKG.
His bundle Fig 10 SA node Accessory pathways AV node 1 Right bundle branch Left bundle branch - Normal electrical pathway Wolff-Parkinson-White syndrome Delta wave Delta wave
Sinus Bradycardia
Sinus bradycardia (Fig 11) - a heart rate less than 60 beats/min due to slow firing of the SA node. SINUS BRADYCARDIA Impulses originate at S-A node at slow rate Fig 11 1 All complexes normal, evenly spaced. Rate < 60/min.LECTURE 11: ELECTROCARDIOGRAM
Sinus Arrhythmia
Sinus arrhythmia (Fig 12) - irregular heart rate due to SA node firing at an irregular rate. SINUS ARRHYTHMIA Impulses originate at S-A node at varying rate Fig 12 Î MEDULLA ADIANCATA All complexes normal, rhythm is irregular Longest R-R interval exceeds shortest > 0.16 s
Atrial Fibrillation
Atrial fibrillation (Fig 13) - disorganized conduction through the atria; no clear P-waves, atria is an ineffective pump, ventricular filling incomplete. ATRIAL FIBRILLATION Fig 13 Impulses have chaotic, random pathways in atria Baseline irregular, ventricular response irregular
Ventricular Fibrillation
Ventricular fibrillation (Fig 14) - disorganized conduction through the ventricle; irregular rhythm. Ventricular Fibrillation Chaotic rhythm and rate Fig 14 @2021 Cleveland ClinicLECTURE 11: ELECTROCARDIOGRAM
First Degree Atrioventricular Block
First degree atrioventricular block (Fig 15): long PR interval, but all components are present. A-V BLOCK, FIRST DEGREE Atrioventricular conduction lengthened Fig 15 R P T P-R Partial block P-wave precedes each QRS-complex but interval is > 0.2 s
Second Degree Atrioventricular Block
Second degree atrioventricular block (Fig 16): some P waves do not elicit QRS (QRS is dropped). A-V BLOCK, SECOND DEGREE Sudden dropped QRS-complex Fig 16 QRS absent R QRS absent 1 ₽ 0 P 5 Partial block Intermittently skipped ventricular beat
There are several types of second degree AV blocks (Fig 17). Mobitz I is benign and is characterized by progressively lengthening PR interval before a dropped QRS. Mobitz II requires intervention and is characterized by constant PR intervals with intermittent dropped QRS.
Mobitz I or Wenckebach Fig 17 Mobitz II 3LECTURE 11: ELECTROCARDIOGRAM
Third Degree Atrioventricular Block
Third degree atrioventricular block (Fig 23): complete disconnect between atria and ventricles; atria and ventricles beat at their own rates (atria > ventricle).
A-V BLOCK, THIRD DEGREE Impulses originate at AV-node and proceed to ventricles Atrial and ventricular activities are not synchronous Fig 23 RR R-R R R R Î P T P TIP PT Total block P-P P-P P-P P-P interval normal and constant, QRS complexes normal, rate constant, 20 - 55 /min
Can’t find what you’re looking for?
Explore more topics in the Algor library or create your own materials with AI.
