Gene Expression Studies: Northern Blotting and DNA Microarrays
Slides about Gene Expression Studies. The Pdf, suitable for university students in Biology, explores methodologies like Northern Blotting and DNA microarrays, detailing their principles and applications. This material, produced in 2023, offers a clear and pertinent didactic resource for self-study.
See more13 Pages

Unlock the full PDF for free
Sign up to get full access to the document and start transforming it with AI.
Preview
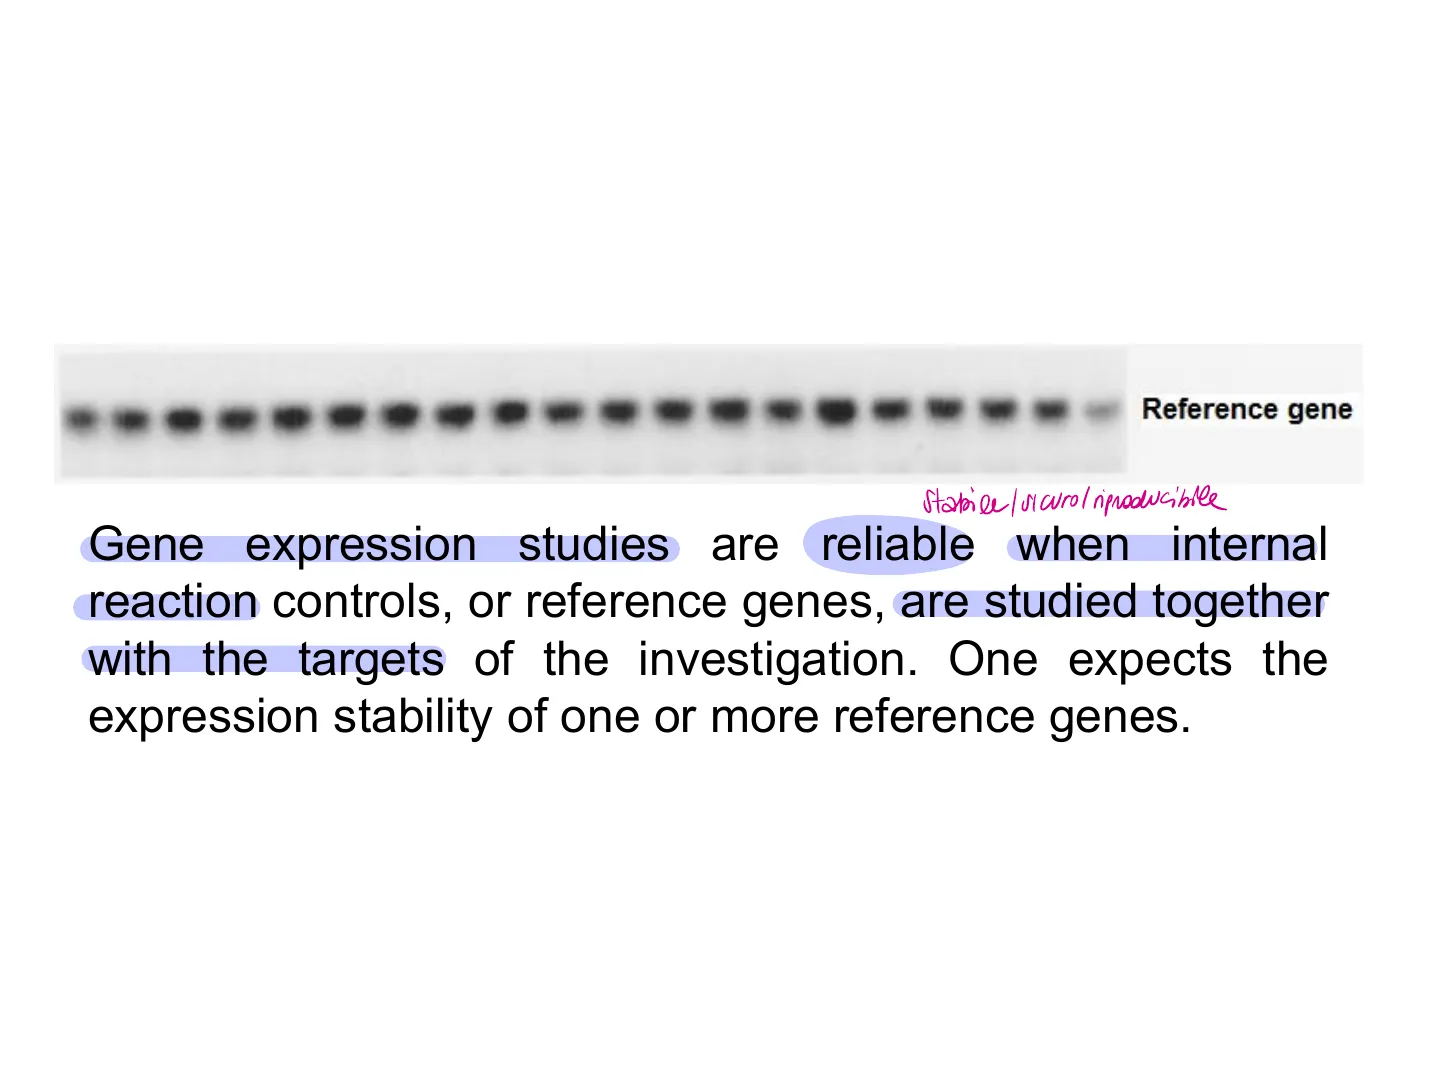
Reference Gene Stability
Reference gene Stabile/ sicuro/riproducibile Gene expression studies are reliable when internal reaction controls, or reference genes, are studied together with the targets of the investigation. One expects the expression stability of one or more reference genes.
Gene Expression Studies: Northern Blotting
Several methods are in use to study gene expression at the transcriptional level *. Among them:
- a northern blot;
- a qPCR;
- a DNA microarray.
Seeking for their transcribed mRNA following a stimulus- a northern blot; RNA extraction- a northern blot; STEPS
Northern Blotting Steps
(A) (B) (C) Blotting paper Nitrocellulose filter Spacers Gel Gel Gel Wick paper Tray containing buffer solution Support Wick of filter paper C) Lay nitrocellulose filter on top of gel; place blotting paper on filter; add weight. RNA moves to filter by capillary action A) Add RNA samples to gel and separate according to size by gel electrophoresis B) Place gel on wet filter paper between two spacers (1)) D) Add radioactive single-stranded probe DNA Scalable- bag = Probe hybridizes with RNAs of interest -RNA Probe (E) E) Prepare autoradiograph and study the results Target gene RNA sequence of interest Reference gene RNA samples Weight- a northern blot; RNA extraction
- Load an equal RNA amount (a few ug) in each well (NOT an equal volume). We can have Same volume but different RNA concentration
Gene Expression Studies: DNA Microarray
Several methods are in use to study gene expression at the transcriptional level *. Among them:
- a northern blot;
- a qPCR;
- a DNA microarray.
*Seeking for their transcribed mRNA following a stimuluscollection of gene-specific DNA molecules
- PCR amplification
- robotic 'printing' onto glass slide mRNA from sample 1 labeled with red fluorochrome mRNA from sample 2 labeled with green fluorochrome HYBRIDIZE
- WASH
- SCAN RED AND GREEN SIGNALS AND COMBINE IMAGES
- small region of microarray Developed in the 1990s, DNA microarrays have revolutionized the way in which gene expression can be analyzed by allowing the RNA products of thousands of genes to be monitored at once. By examining the expression of SO many genes simultaneously, we can now begin to identify and study the gene expression patterns that underlie cellular physiology: we can see which genes are switched on (or off) as cells grow, divide, or respond to hormones or to toxins.
DNA Microarray Technology
DNA microarrays are little more than glass microscope slides studded with a large number of DNA fragments, each containing a nucleotide sequence that serves as a probe for a specific gene. The most dense arrays may contain tens of thousands of these fragments in an area smaller than a postage stamp, allowing thousands of hybridization reactions to be performed in parallel.DNA microarrays (or DNA chips) are a commonly used technique to globally monitor cellular abundances of transcript species. A DNA microarray is a collection of microscopic DNA spots attached to a solid surface. Each DNA spot contains many thousands of copies of a specific DNA sequence, known as probes. These usually correspond to a short section of a gene transcript - generally at the 3' end. Each microarray includes one or a few probe sets for each interrogated gene. These are used to hybridize two compared cDNA samples (the target) under high-stringency conditions. Probe-target hybridization is usually detected and quantified by detection of fluorophore-, -labeled targets to determine the relative abundance of transcripts in the target sample.
DNA Microarray Process
O mRNA L reverse transcriptase L cDNA DNA microarrayO O
-
mRNA
-
reverse transcriptase
-
cDNA
124 . HAZET Experiment (example): Gene profiling during morphogenesis ...
Gene Profiling During Morphogenesis Example
· 12 genes are studied, each linked to a specific phenotype (ex stem cells 7-9-11) · the experiment checks gene expression at 4 stages: A) STARTING B) EARLY C) INTERMEDIATE D) LATE · At each stage the color of the samples changes for genes that are active: some genes change color, others don't. This allows tracking gene activity and how cells develop from stem cells to specialized tissues
Gene Phenotype Mapping
Gene Phenotype 7 = Nanog Stem 9 = Oct 4 11 = Sox 2 3 = GATA 4 Heart (early) 5 = MEF 2C 8 = Nkx 2.5 1 = Actin Heart (intermediate) 6 = Myosin 2 = Cx 43 12 = TnT I 4 = GFAP 10 = p75 Heart (differentiated) Neuro
Gene Expression Studies: QPCR
Several methods are in use to study gene expression at the transcriptional level *. Among them:
- a northern blot;
- a qPCR;
- a DNA microarray.
*Seeking stimulus for their transcribed mRNA following a
Reverse Transcription Real-Time PCR (RT-qPCR)
Reverse Transcription real-time PCR (RT-qPCR): Gene expression Analysis
- RT-qPCR is used to analyse the level of expression of one or more target genes comparing two or more conditions (i.e. control vs. treated; normal vs. disease cells; undifferentiated state vs. specific tissue phenotype commitment; differential time points, .. ).
- The gene expression analysis is semi-quantitative, therefore it produces a result as a ratio: the relative amount (fold difference) of a target gene for equivalent amounts of test and control sample A vs. B.
. A normalizer is needed (i.e. number of cells used in template preparation, ug of nucleic acid used as PCR template, expression level of a reference gene).The 2-44Ct Method (Livak
2-ΔΔCt Method for qPCR Data Analysis
- The 2-AACT method has been extensively used as a relative quantification strategy for quantitative qPCR data analysis.
. This method is a convenient way to calculate relative gene expression levels between different samples in that it directly uses the threshold cycles (CTs) generated by the qPCR system for calculation. . This approach relies on the assumption of 100% PCR amplification efficiency across all samples (ideally the template is doubled each cycle => E=10 -1/slope = 2 (slope =- 3.32) ).
Can’t find what you’re looking for?
Explore more topics in the Algor library or create your own materials with AI.
