Consequences of globalization for global development and the physical environment
Slides from University about Globalization Consequences for Global Development and the Physical Environment. The Pdf, an Economics document for University students, analyzes the impacts of globalization on wealth distribution and environmental disparities, examining global GDP growth versus population.
See more33 Pages


Unlock the full PDF for free
Sign up to get full access to the document and start transforming it with AI.
Preview
Globalisation and Development
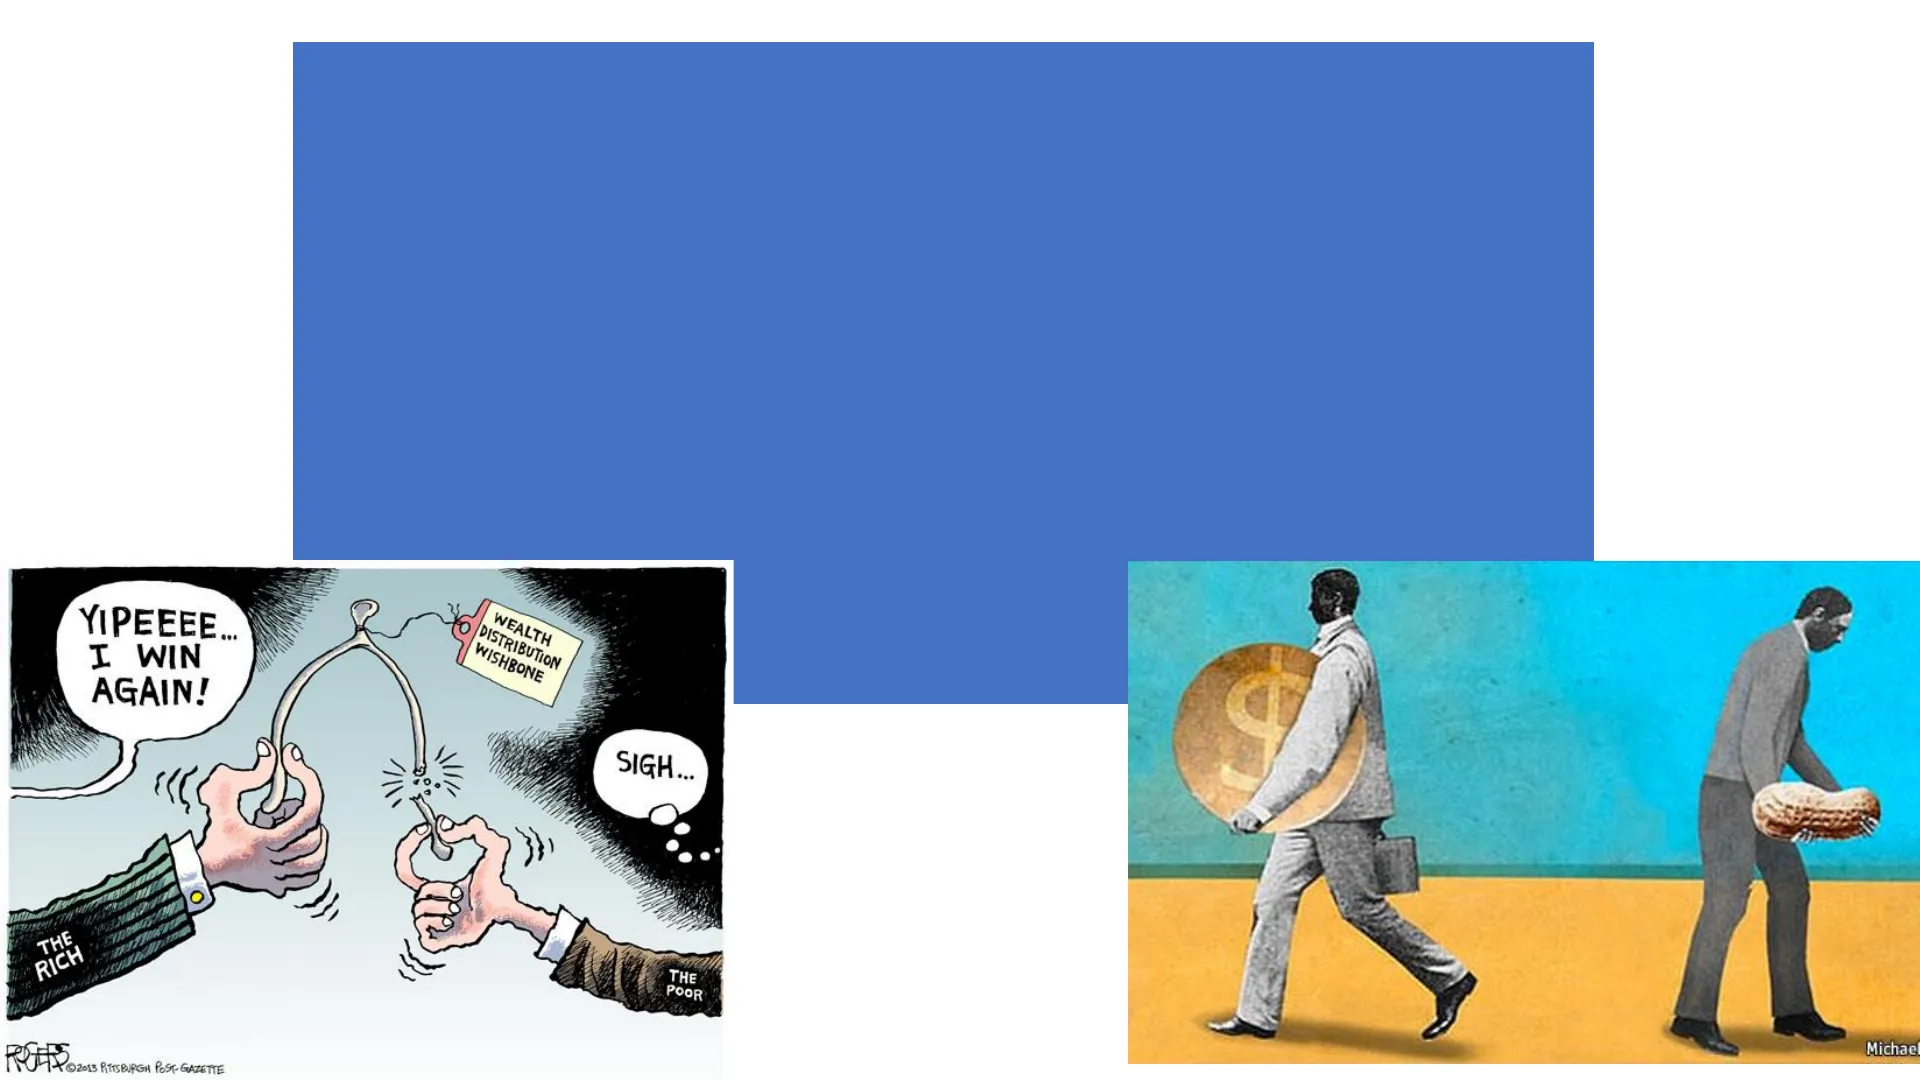
EQ3: What are the consequences of globalisation for global development and the physical environment and how should different players respond to its YIPEEEE ... I WIN AGAIN! WEALTH DISTRIBUTION WISHBONE SIGH ... THE RICH THE POOR challenges? +@2013 PITTSBURGH POST-GAZETTE MichaelKey idea Globalisation has led to dramatic increases in development for some countries, but also widening development gap extremities and disparities in environmental quality. Highlight spec link covered in this lessonONY
Globalisation's Impact on Wealth
Gres GREENLAND OCEAN Heaufort Sea CANADA UNITED STATE UNITED STATES Ci Aliska How has globalisation made the world richer?
- Big increases in global trade between nations
- Cheaper prices for consumers by using a global supply chain (esp. in HICs)
- Increased employment and consumption in LICs boosting economies
· Critics of globalisation assert that 'the rich get richer while the poor get_poorer _. ' Is this true? Oxfam calculated that the richest_1%_ per cent of people had the same wealth as the poorest_6.9_billion in 2019. The result is an ‘explosion in _inequality ' at a time when 1 billion people still live on less than us_US$1.90_per day. This indicates that DEVELOPMENT GAP extremities (the __ range_ of values between the world's very richest and poorest people and countries) have not reduced _.. However, it does not necessarily follow that poorer people must actually lose _. money in order for the rich to make gains_ ; globalisation is not a 'zero-sum' game.
· Study the graph - Overall, the global economy has grown enormously, far faster than its population. GDP was at its lowest in at approximately US dollars (trillions), and it increases rapidly to (trillions) in . US dollars90 18 80 - 16 GDP 70 - 14 US dollars (trillions) 60 - 12 50 10 40 8 Population 30 - 6 Population (billions) 20 4 10 2 0 0 2010 2011 2012 2013 2014 2015 2016 2017 2018 2019 Year Figure 14.1 Comparing growth in world GDP (nominal) and world population, 1910-19
Poverty Definitions
Absolute Poverty
Absolute poverty · When a person's income is too low for basic human needs to be met, potentially resulting in hunger and homelessness
Relative Poverty
Relative poverty · When a person's income is too low to maintain the average standard of living in a particular society. Asset growth for a very rich people can lead to more people being in relative poverty.
Globalisation and Poverty Reduction
· Globalisation has not pushed large numbers of people into absolute poverty. Instead, global poverty has been halved since the introduction of the Millennium Development goals in 2000, with the greatest progress being made in Asia · . What were the MDGs (Millennium Development goals)? Eight specific objectives for the global community created at the UN Millennium Summit in New York in 2000.
· It is true that the number of people living in relative poverty has risen in many societies, however. When the assets and earnings of the hyper rich balloon in value, the average per capita = per person) level of wealth rises. As a result, some poorer people- whose earnings are static or have risen modestly, are reclassified as having_below average incomes despite the fact they have experienced no material decline in wealth.
· To summarise, 'the rich get richer while the very poorest do not' is perhaps a more accurate view.Who has benefited from this?
Globalisation and Development Gap
Globalisation and Development MIND THE GAP
Understanding Development
Development . "Development means the ways in which a country seeks to develop economically and to improve the quality of life for its inhabitants."
. A country's level of development is shown firstly by economic indicators of average national wealth and/or show income, but encompasses social and political criteria also.
Development Cable Analogy
Development Cable Development has been likened to an electric cable - the power to drive countries from primitive to more advanced states passes through a development cable. Core is economic growth, technology and enterprise. The outer casing is composed of many different strands. The strands represent many different aspects of development growth. Development energy generated in core by exploitation of resources Outer strands may also be seen as the outcomes of development Social justice Life expectancy Equal opportunities Birth/death control Quality of life onomic gr Mobility Satisfaction Personal wealth CORE Education rise Freedom of speech Culture Democratic government Identity Environmental change Conservation Sustainability Outer strands are an integral part of development Cross-section reveals state/level/stage of development Key Demographic Environmental Social Political Cultural
Economic and Social Development Linkages
Farming incomes start to rise School attendance improves Fairtrade (offers a higher guaranteed price for products) Microloans (affordable credit that can help farmers grow a bigger crop and sell the surplus for cash) More money (families can afford to pay for school fees and school books) Poverty reduction (by reducing poverty, a range of human needs are met, such as health and education) f ial Increased pay (due to large companies acting ethically and responsibly when they buy food and other goods from suppliers) Less hunger (children do not have to go to school hungry and can concentrate better) Life choices (as they grow up, children can take the decision not to be farmers; they can choose other forms of work or study for a profession instead) Figure 14.3 Economic and social development linkages Choice and opportunity More time (children no longer have to work on the farm)
Measuring Development
How is development measured?
Development Indicators
Measuring Development Many different statistics are used to measure development. These are called development indicators Development Indicators can consist of: – Single Variable Indicators, e.g. life expectancy Composite Indicators, e.g. HDI Economic factors Social & welfare factors · GDP · literacy . GNP . educational opportunity post primary · birth/death rates · trade deficit · mineral/energy resources · heath care provision · HIV/AIDS · immunisation programmes Technology and Industry Other factors · political stability · infrastructure development · democratic government · energy usage · civil war · access to TV/phone/internet · political corruption · subsistence/commercial agriculture · manufacturing activities · tertiary sector Summary · Can a single indicator suffice? . Which sorts of indicators give the best picture? · Why do you take this position? • – • · occupation structure of population · imports/exports · infant mortality rate · life expectancy
1. Economic Indicators
1. Economic Indicators . Economic indicators are usually felt to be the most important in measuring development and SOL - why? · What economic indicators can you think of?
1. Economic Indicators · Income per capita · GDP · Economic sector balance · Purchasing Power Parity
Income per Capita
Income per capita . Income per capita is the mean average income of a group of people. It is calculated by taking an aggregate source of income for a country, or smaller region, and dividing it be population size to give a crude average.
. Limitation: can give a misleadingly high 'typical' figure if large number of high-earners inflate the mean).
Gross Domestic Product (GDP)
GDP GDP = Gross Domestic Product · GDP is a traditional and economic measure of development. It is the total value of goods and services produced by a country during one year.
· GDP per capita is where the money is then divided per person in the population to give a more reliable average. GDP (PPP) Per Capita 2005 (ŞUS) 30 000+ 20~30 000 10~20 000 5~10 000 3~5 000 1~3 000 less than 1 000 no data
Gross domestic product per capita in the United Kingdom from 1955 to 2022 (in GBP) 40,000 35,000 GDP per capita in GBP (CVM 2019)* 30,000 25,000 20,000 15,000 10,000 1955 1958 1961 1964 1967 1970 1973 1976 1979 1982 1985 1988 1991 1994 1997 2000 2003 2006 2009 2012 2015 2018 2021 Source Office for National Statistics (UK) @ Statista 2023 Additional Information: United Kingdom; Office for National Statistics (UK); 1955 to 2022 Analyse: Describe and explain Describe patterns - use some maths to help describe the changes/trends Anomalies/outliners? Reasons why? Any limitations?
Purchasing Power Parity (PPP)
Purchasing Power Parity Purchasing power parity (PPP). A method of measuring the relative purchasing power of different countries' currencies over the same types of goods and services taking into account cost of living. Because goods and services may cost more in one country than in another, PPP allows us to make more accurate comparisons of standards of living across countries. >120% of USD 110% 100% 90% 80% 70% 60% 50% 40% 30% 20% <20% of USD
Big Mac Index
Big Mac index Local currency under (-)/over (+) valuation against the dollar, % 60 40 20-0+20 40 60 Switzerland 4.93 Denmark 4.49 Sweden 4.28 Euro area 3.51+ Britain 3.32 United States 3.15+ New Zealand 3.08 Turkey 3.07 Canada 3.01 Chile 2.98 Brazil 2.74 Hungary 2.71 Mexico 2.66 Czech Republic 2.60 South Korea 2.56 Australia 2.44 Taiwan 2.35 South Africa 2.29 Singapore 2.20 Japan 2.19 Poland 2.09 Egypt 1.61 Russia 1.60 Philippines 1.56 Argentina 1.55 Hong Kong 1.55 Indonesia 1.54 Thailand 1.51 Malaysia Big Mac 1.47 China price*, S 1.30 *At market exchange rate (January 9th) tWeighted average of member countries #Average of four cities Source: The Economist using McDonald's price data
Limitations of Economic Indicators
Limitations . GDP fails to take account of foreign earnings and does not account for cost of living . Often fail to include the informal economy or subsistence farming (so will underestimate LICs) . Can be distorted by high levels of inequality within a nation (making GDP per capita look much greater than it is) · Only focuses on economic
Economic Sector Balance
Economic sector balance . A country or region's economy can be crudely divided into four economic sectors whose relative importance changes as a country develops. A country's economic sector balance is also used as part of the annual GDP calculation. Every few years, each country devises a new formula that estimates the contribution that different economic sectors, such as agriculture and manufacturing, make to total national income.
Human Development Index (HDI)
HDI · The Human Development Index (HDI) is a composite measure that ranks countries according to economic criteria (GDP per capita, adjusted for purchasing power parity) and social criteria (life expectancy and literacy).
· The three ingredients are processed to produce a number between 0-1. In 2019, Norway ranked in first place (0.954) and Niger ranked in last place (0.377). Life expectancy The numbers of years that a person can be expected to live from birth. Women generally live longest in any society Income The HDI uses a measure of wealth derived from the gross national income (GNI) of a country (an alternative measure to GDP) Education The HDI uses an education index based on the average number of years of schooling for people in a country HDI Figure 14.5 The Human Development Index
Can’t find what you’re looking for?
Explore more topics in the Algor library or create your own materials with AI.
