Our Solar System: Ancient Worlds, New Discoveries by Stanford Solar Center
Slides from Stanford Solar Center about Our Solar System – Ancient Worlds, New Discoveries. The Pdf explores the solar system, concentrating on Venus and Earth, presenting scientific data and descriptions of their features for high school Science students.
See more46 Pages

Unlock the full PDF for free
Sign up to get full access to the document and start transforming it with AI.
Preview
Our Solar System Overview
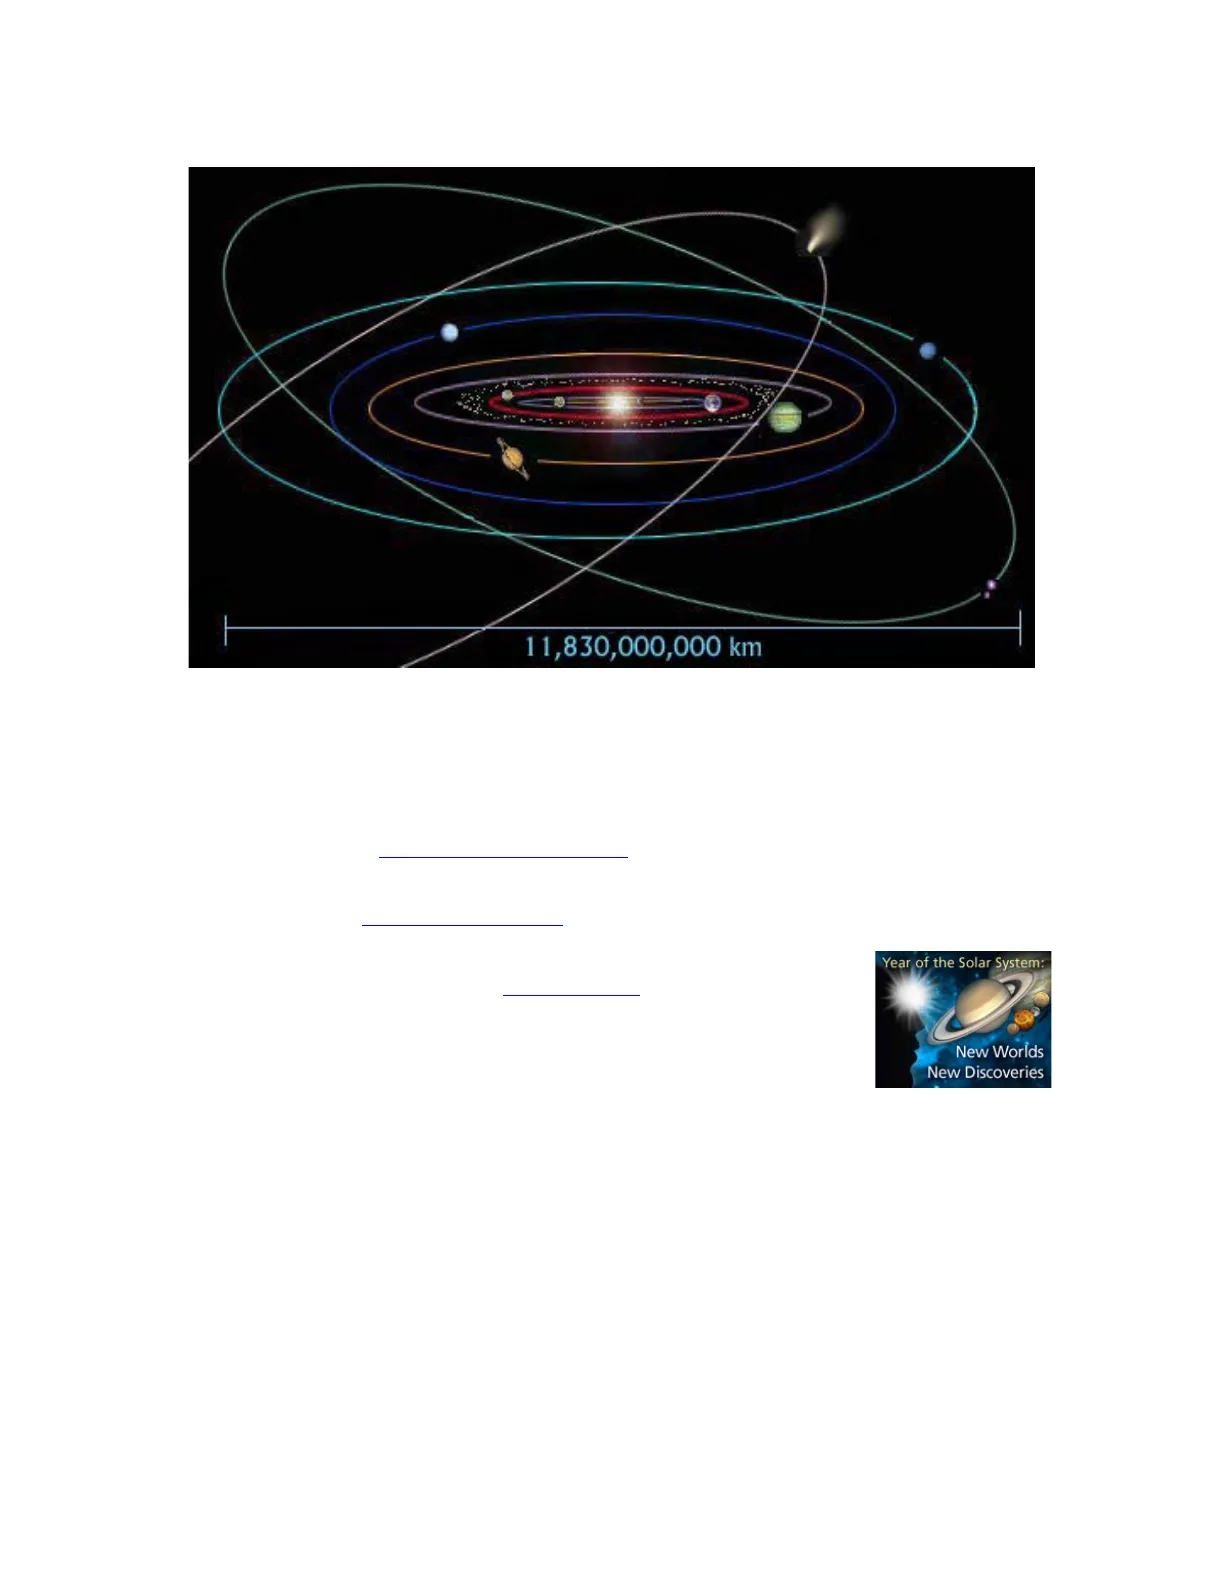
Year of the Solar System: New Worlds New Discoveries Our Solar System - Ancient Worlds, New Discoveries ON THE SOLAR OSIERWATORY Prepared by Deborah Scherrer Stanford Solar Center SOLAR CENTER11,830,000,000 km This graphic of the solar system was made using real images of the planets and comet Hale-Bopp. It is not to scale! To show a scale model of the solar system with the Sun being 1cm would require about 64 meters of paper! Image credit: Maggie Mosetti, NASA This book was produced to commemorate the Year of the Solar System (2011-2013, a martian year), initiated by NASA. See http://solarsystem.nasa.gov/yss. Many images and captions have been adapted from NASA's "From Earth to the Solar System" (FETTSS) image collection. See http://fettss.arc.nasa.gov/. Additional imagery and captions compiled by Deborah Scherrer, Stanford University, California, USA. Special thanks to the people of Suntrek (www.suntrek.org,) who helped with the final editing and allowed me to use Alphonse Sterling's awesome photograph of a solar eclipse! Year of the Solar System: New Worlds New Discoveries Cover Images: Solar System: NASA/JPL; YSS logo: NASA; Sun: Venus Transit from NASA SDO/AIA C 2013-2020 Stanford University; permission given to use for educational and non-commercial purposes.
Table of Contents
Table of Contents Why Is the Sun Green and Mars Blue? 4 Our Sun - Source of Life 5 Solar Activity 6 Space Weather 9 Mercury 11 Venus 13 Earth 15 Earth's Moon 17 Meteors and Impacts 18 Mars 19 Mars's Moons - Phobos, Deimos 22 Asteroid Belt 23 Jupiter 25 Jupiter's Moons, including Io, Europa, Ganymede, Callisto 26 Io 27 Europa 27 Ganymeade 28 Callisto 28 Saturn 29 Saturn's Moons, including Titan, Enceladus, Iapetus, Hyperion, Phoebe 31 Titan (and Tethys) 31 Enceladus 32 Iapetus 32 Hyperion 33 Phoebe 34 Uranus 35 Uranus's Moons 36 Neptune. 38 Neptune's Moons, including Triton 39 Triton 39 The Kuiper Belt, Dwarf Planets, Trans-Neptunian Objects, and Comets 40 Dwarf Planets 40 Trans-Neptunian Objects 41 Comets 42 Interplanetary Dust Particles 43 The Sun's Heliosphere 44 Where Are We? 45 Our Immense Universe 46
Getting Started
Our Solar System Getting Started 500/AMA 94 2011-08-29 19:30:03 UT
Why Is the Sun Green and Mars Blue?
Human eyes see only visible light. Visible light is made up of all the colors of the rainbow (sometimes labeled red, orange, yellow, green, blue, violet) which, when combined, look white to our eyes. But there are many other, invisible forms of light, i.e. the electromagnetic spectrum - radio, microwaves, infrared, ultraviolet, X-rays, gamma rays. The various parts of the electromagnetic spectrum are differentiated by their wavelengths - radio wavelengths can be kilometers long and gamma ray wavelengths smaller than atoms.
Electromagnetic Spectrum Wavelengths
10-12 meters 10° 1 nanometer 10€ 103 1000 nanometer - - 10° 1 millimeter 1 meter - 10° 1 kilometer - 1 Cosmic rays X-rays Microwaves Radio Broadcast band Gamma rays Ultraviolet (UV) Infrared (IR) Radar Short Wavelenghts Long Wavelengths Visible Light Ultraviolet (UV) Infrared (IR) 400 nanometers 500 nanometers 600 nanometers 700 nanometers
False Color Imaging
Many scientific instruments are designed to detect infrared, ultraviolet, X-ray, or other wavelengths. These invisible forms of light have no colors associated with them. So scientists have their computers assign unusual colors (like neon orange) to their images, to allow them to observe details. The green Sun, above left, is a photo of the Sun taken in extreme ultraviolet light, which our eyes cannot see. The scientists have artificially colored the ultraviolet data green. We call that "false color". Scientists also use false color to indicate additional information. The image of Mars, above right, shows the concentration of methane in Mars's atmosphere. Scientists have color-coded the highest concentrations of methane as red, the lowest in blue, to help us and them understand the data. Many of the images in this collection are likewise false colored. We have tried to highlight which images come from visible light and which represent false color or color-coded data. Image Credits: Green Sun NASA/SDO/AIA; Blue Mars - NASA/JPL 4
Our Sun - Source of Life
Our Sun - Source of Life A total solar eclipse, as observed from Earth. Image Credit: Alphonse Sterling and the Suntrek website (www.suntrek.org) Used with permission The Sun is our very own star, at the center of our solar system. The Sun is scientifically designated as a yellow dwarf (because of its place on the HR diagram1). However, our Sun is neither yellow nor a dwarf. The Sun appears white to the human eye -- it only looks yellow or orange when its rays are being scattered by Earth's atmosphere during sunrise and sunset. And it is now thought to be brighter and larger than about 85% of the stars in the Milky Way galaxy, most of which are red dwarfs (stars with low mass that shine in a relatively cool red). The Sun consists of hot plasma (a state of matter where electrons have been stripped from their atoms) interwoven with magnetic fields. It has a diameter about 109 times that of of Earth, and a million Earths could fit inside it! Its mass accounts for about 99.86% of the total mass of the solar system. About three-quarters of the Sun consists of hydrogen; the rest is mostly helium. Less than 2% consists of heavier elements, including oxygen, carbon, gold, iron, and others. Many of these elements were originally forged in supernova explosions. So we, and everything in our solar system, are made of "star stuff"'2. Every second, the Sun fuses 614 million metric tons of hydrogen into 609 metric tons of helium in its core. The difference is converted into gamma rays that eventually get 1 The Hertzsprung-Russell diagram plots the temperature of stars against their luminosity/brightness. See https://astronomy.swin.edu.au/cosmos/H/Hertzsprung-Russell+Diagram 2 Quote from Carl Sagan 5
Solar Wind and Heliosphere
Our Solar System radiated at the solar surface as lower-energy photons, primarily visible light. The Sun's hot atmosphere, called the corona, continuously expands in space creating the solar wind, a stream of charged particles that extends beyond the solar system. The bubble in the interstellar medium formed by the solar wind, called the heliosphere, is the largest continuous structure in the solar system. Image Credit: ESA/ NASA's SOHO Mission (false color)
Solar Activity
Solar Activity Our Sun is a dynamic, active, and constantly changing star. Solar activity is driven by intense magnetic fields, generated deep within the solar interior then buoyantly rising up through its surface. Plasma caught in the magnetic field lines allows us to see these fields, as in the previous composite image.
Sunspots and Magnetic Fields
SDO/HMI Quick-Look Continuum: 2011.05.31_19:29:15_TAI Visible light image of the Sun Image credit: NASA SDO/HMI SDO/HM Quick-Look Mognetogram: 2011.05.31_19:29:15_TAI Solar magnetic fields Image Credit: NASA SDO/HMI On the left is a true color image of the Sun. The dark splotches are called sunspots. The image on the right, taken at the same time, is a map of the magnetic fields on the Sun. White indicates a positive field, and black a negative one (grey indicates little or no field). Note how the sunspots are associated with the magnetic fields - most activity on the Sun is a result of complex magnetic fields! 6
Solar Flares
Our Sun Image credit: Jack Newton (false color) Image Credit: Scharmer and K. Langhans, ISP Royal Swedish Academy of Sciences. (false color) Sunspots are temporary regions of reduced surface temperature caused by increased magnetic activity. The Sun goes through a cycle of about 11 years when it has a period of many sunspots (solar maximum), then few or no sunspots (solar minimum). Sunspots or similar magnetically active regions are the source of solar storms. The Sun's magnetic fields are constantly in motion. When solar magnetic fields twist, break, and then reconnect, they can release a tremendous amount of energy. We see these as solar flares, like the white brightening near the center of the image on the right. Solar flares eject radiation and fast moving particles that can damage satellites, disrupt communications, and give high-flying planes and astronauts additional doses of radiation. Finding ways to protect astronauts from solar flares is one of the biggest challenges of going back to the Moon or to Mars. Image Credit: NASA/SDO (false color) SDO/AIA 94 2011-02-15 02:20:51 UT 7
Prominences and Coronal Mass Ejections
Our Solar System ESA3/NASA's Solar and Heliospheric Observatory (SOHO) produced the spectacular portrait (left) of our star. Featured is a huge, handle-shaped prominence-a cloud of relatively cooler plasma held aloft high in the corona (the Sun's atmosphere) by a large magnetic field that is rooted in the solar surface. A typical prominence extends over thousands of kilometers, and can last from minutes to months. Image Credit: ESA/NASA's SOHO spacecraft (false colors) Sometimes prominences erupt into coronal mass ejections (CMEs), as in the image on the right. These huge blasts of charged plasma, traveling at 1400 km/s, can impact objects of the solar system. Luckily, Earth's magnetic field acts as a shield, partially protecting us. But CME impacts on Earth may still generate effects such as aurora, satellite drag, power outages, communications disruptions, and GPS interference. Image Credit: NASA/SDO/AIA (false colors) Image Credits: NASA/Stanford-Lockheed Institute for Space Research's TRACE Team (false color) A close-up view of the Sun's surface, observed by NASA's Transition Region and Coronal Explorer (TRACE) mission, shows vast loop structures made of superheated plasma trapped in magnetic field lines. About 10 Earths could fit across any one of these loops! These areas of solar activity can contain multiple loops, often in "tunnel" The European Space Agency 8
Plasma Loops and Temperature
Our Sun formations, that can persist for weeks. The plasma reaches temperatures of more than 1,000,000 C° - whereas the Sun's surface temperature averages only about 5500 Cº! Flares and CMEs usually erupt from active regions such as these.
Space Weather
Space Weather Image Credits: NASA (Definitely not to scale!) Space weather refers to the affect the Sun has on the Earth and rest of the solar system. The solar wind is a fairly constant stream of charged particles, mostly high-energy electrons and protons, ejected from the upper atmosphere of the Sun. These particles can escape the Sun's gravity because of their high kinetic energy and the high temperature of the corona. As the solar wind buffets the Earth's magnetic field, it distorts it into a long oval, as shown in the (not-to-scale) image above. Radiation storms and CMEs have the potential to seriously affect Earth and our modern technology. Besides triggering beautiful aurorae, these solar storms can damage satellites, disrupt power grids and electrical systems, interfere with cell phones and other communications, and disturb animal movements. They can even threaten astronauts and high-flying airplanes with their radiation! Space weather affects not only Earth but the other planets as well.
Solar Dynamics Observatory
Our Eye on the Sky - Launched in February 2010, NASA's Solar Dynamics Observatory (SDO) mission is designed to study the Sun's variability and its effect on space weather, with the goal of eventually predicting dangerous solar activity. NASA's SDO spacecraft 9
Can’t find what you’re looking for?
Explore more topics in the Algor library or create your own materials with AI.
