Microeconomics Summary Notes: Demand, Externalities, and Market Failure
Document from University about Microeconomics Summary Notes. The Pdf provides a concise overview of microeconomics for university students, covering demand, supply, externalities, and market failures, with clear diagrams and a schematic structure for quick study in Economics.
See more46 Pages


Unlock the full PDF for free
Sign up to get full access to the document and start transforming it with AI.
Preview
Demand
Market
● Market ○ Where buyers and sellers come together to carry out an economic transaction
Demand
· Demand o Quantity of a good or service that consumers are willing and able to purchase at different prices in a given time period
Law of Demand
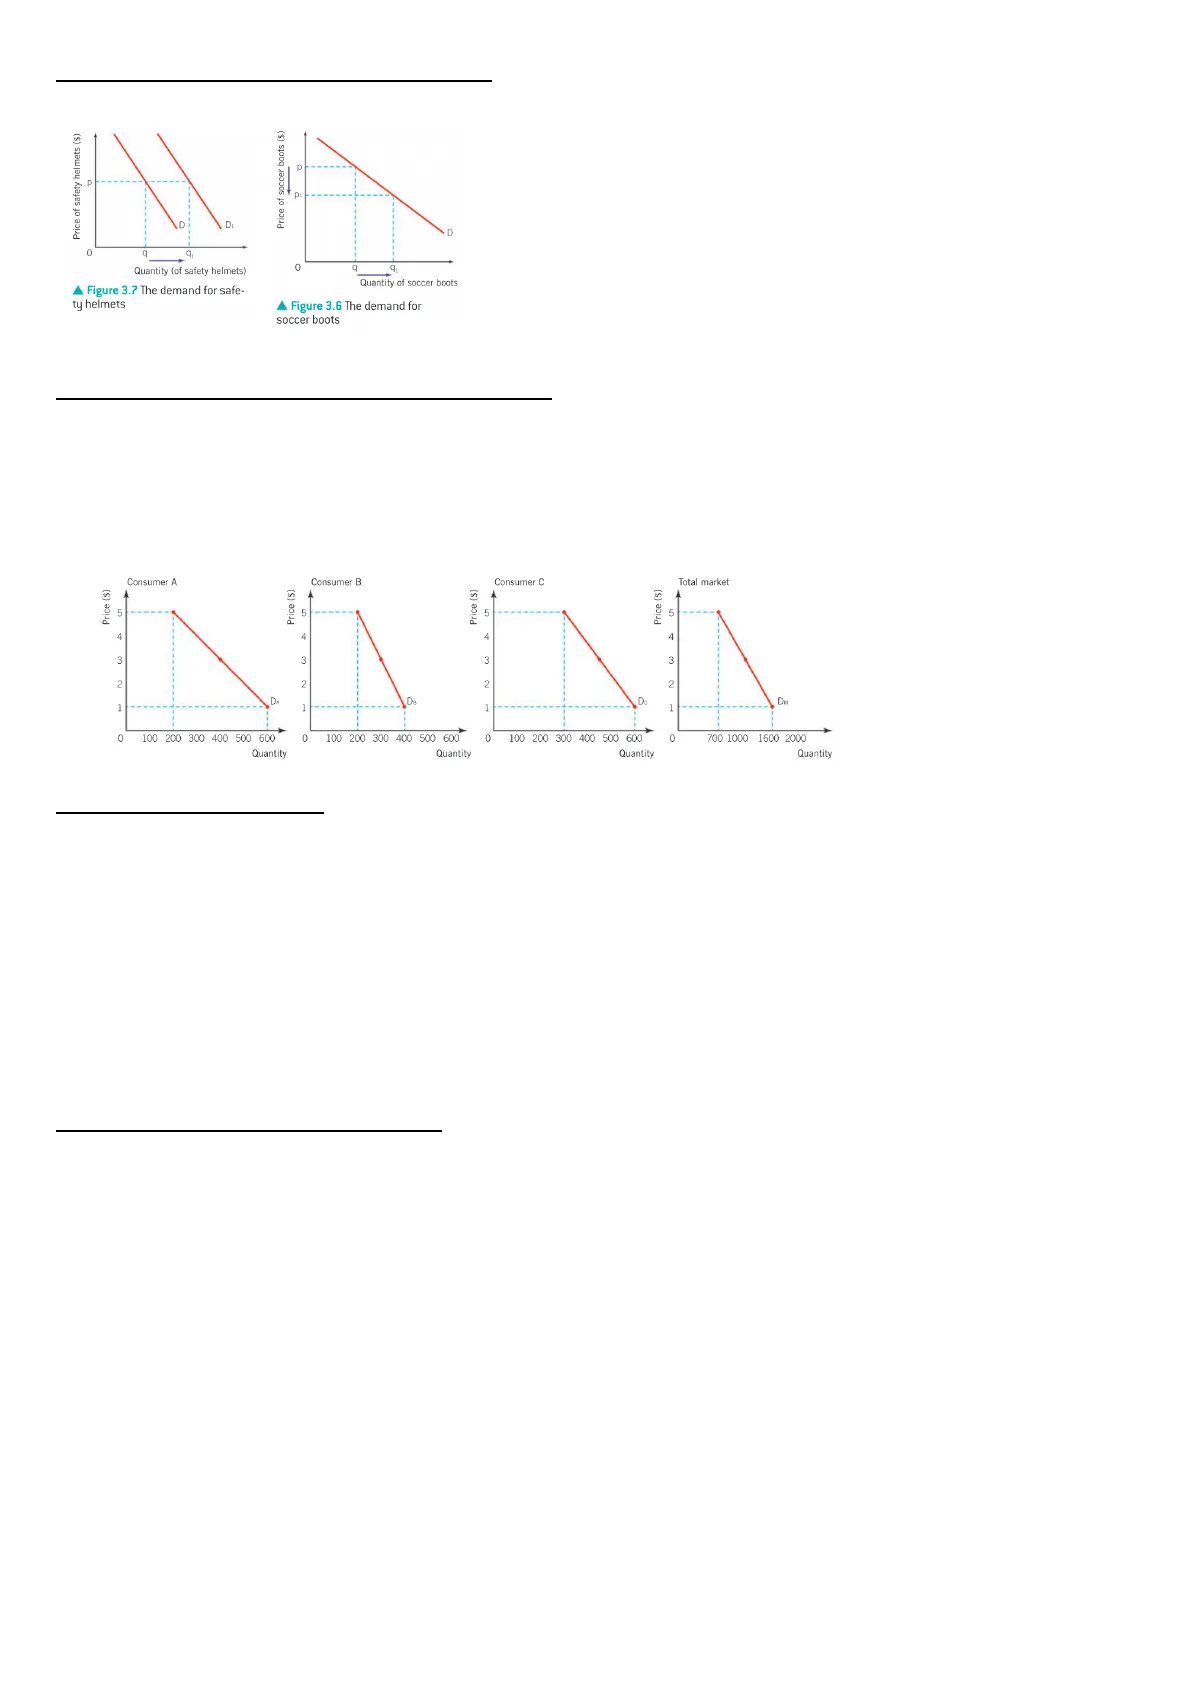
· Law of Demand ○ As the price of a product falls, the quantity demanded of the product will usually increase, ceteris paribus · Demand Schedule A table changing the quantity demanded as the price changes ○ · Demand Curve 0 Curve that shows the relationship between the price of a product and the quantity demanded of the same product over time · Movement Along Demand Curve ○ Change in the price of a product · Shift of Demand Curve ○ Change in the non price determinants of demand
Non-Price Determinants of Demand
· Income ○ Normal goods As income rises, demand for product rises ○ Inferior goods Demand for product falls as income rises · Price of Related Goods ○ Substitutes Change in the price of one of the products will lead to a change in the demand for the other product o Completments Products purchased together Change in the price of one product leads to a change in the demand of the other product o Unrelated Goods Change in price of one product will have no effect upon the demand for the other product · Tastes and Preferences · Future Price Expectations · Number of Consumers
Movement along and Shift of Demand Curve
Price of safety helmets ($) C Quantity (of safety helmets) Figure 3.7 The demand for safe- ty helmets Price of soccer boots ($) p P: D 0 q. Quantity of soccer boots Figure 3.6 The demand for soccer boots
Individual Consumer's Demand & Market Demand
· Horizontal summing ○ Constructing demand curve for whole market ○ Adding individual demands at each price -> total market demand Consumer A Consumer B Price ($) Price ($) 5 5 5 5 4 3 2 Du 1 0 100 200 300 400 500 600 O 100 200 300 400 500 600 Quantity Quantity Consumer C Total market Price ($) Price (S) 700 1000 1600 2000 Quantity Quantity
Explaining Law of Demand
· Income Effect Price of product falls -> Increase in real income ○ Reflects the amount that income can buy · Substitution Effect ○ Satisfaction : Price Will substitute products that take advantage of this relationship · Cheaper product even if slightly less utility
Assumptions behind Theory of Demand
· Assumes that consumers behave rationally o Consumers able to consider all possible options and work out option that will provide most utility 0 Consumer seek to maximise utility ○ Consumers act in own self interest ○ Consumers have access to all relevant information about choices (perfect information) 1 1 DB De 1 0 100 200 300 400 500 600 4 3 3 3 2 2 2 DA D D 0 p 4 4 0 Consumer -> homo economicus
Behavioural Economics
Econs (non-existent, according to Thaler] Humans (all of us!] . Are rational · Have perfect information · Are extremely intelligent, and able to perform complex calculations quickly · Seek to maximize their own utility · Make decisions based on their own self- interest · Have consistent preferences over time · Have no self-control problems · Are unbiased . Have bounded rationality · Have incomplete information · Are not as intelligent as Econs · Have limited ability to carry out complex calculations · Are social beings, and make decisions in a social context · Change their tastes over time · May have self-control issues
Assumptions of Rational Consumer Model
· Perfect Information ○ All economic agents have access to all same information at same time ○ Price and quality of products in market ○ Problems: Information asymmetries · Different economic agents have different levels of information available to them where economic transactions are concerned Processing information · Humans face limits in how can process available information · Internet -> Information overload o -> Consumers make decision based on imperfect information · Bounded Rationality ○ Rationality of consumers is limited by the information that they have, and that they do not have the time or cognitive abilities to consider all options · Bounded Selfishness Humans do not always act in own-self interest as assumed by neoclassical model ○ · Bounded Self Control O Natural tendency to give into temptation
Dual System Model
· System 1: Fast Thinking System ○ Fast decisions ○ Automatic ○ Subconscious · System 2: Slow Thinking System O Slow ○ Controlled decisions
Cognitive Biases & Decision Making
· Availability Bias ○ Availability of recent information and examples tends to over-influence people's decision making · Anchoring Bias 0 Use value of something as reference point to influence future choices or decisions · Framing Bias o The way that information is presented to us influences our choices · Social Conformity/Herd Behaviour The way that others behave can exert a powerful influence on our own choices ○ · Status Quo/Inertia Bias ○ If faced with bewildering set of choices, would prefer to maintain the status quo by doing nothing · Loss Aversion Bias Humans feel that losses are far more significant than gain ○ · Hyperbolic Discounting o Tendency for humans to prefer smaller short-term rewards over larger later rewards
Behavioural Economics & Choices
· Choice Architecture o Theory that the decisions we make are heavily influenced by the ways in which the choices are presented to us . Default Choice ○ Pre-set option that is effectively selected if decision maker does nothing · Mandated Choice People required by law to make a choice in advance ○ · Nudge Theory ○ Choice architecture offered to people can be carefully designed to gently encourage people to voluntarily choose the option which is better for them o Consumer Sovereignty The right to choose is maintained
Elasticity of Demand
Elasticity of Demand
· Elasticity ○ A measure of how much something changes when there is a change in one of the determinants ○ Measure of responsiveness · Elasticity of Demand ○ A measure of how much the demand for a product changes when there is a change in one of the factors that determine demand Price elasticity of demand (PED) Income elasticity of demand (YED)
Price Elasticity of Demand
· Price Elasticity of Demand o A measure of how much the quantity demanded of a product changes when there is a change in the price of the product PED = Percentage change in quantity demanded of the product Percentage change in price of the product · Range of Values 0 0- 00 · PED = 0 ○ Change in the price of a product will have no effect on the quantity demanded ○ Demand is perfectly inelastic · PED = 00 O Demand is perfectly elastic o Any change in the price of a product will result in an infinitely larger change in the quantity demanded · 0 change in price won't lead to a change in revenue Price of product (S) D P P -- 0 0 Price of product ($) P C Quantity demanded of product Price of cartons ($) 0 11.20 a 1.00 b C 0 10.8 12 Quantity of cartons (000s) Price of hot dogs ($) 2.10 a 2.00 b C D 0 180 200 Quantity of hot dogs Price of meals (S) b D 0 Quantity of meals
Elasticity on Curves
· Straight line downward sloping demand curve o PED falls as price falls Price ($) PED = 3.3 (elastic) 20 b 15 PED = 0.625 0 10 Demand becomes less elastic (inelastic) d 5 D 0 50 100 150 200 250 Quantity (units)
Determinants of Price Elasticity of Demand
· Number and Closeness of Substitutes ○ More substitutes -> More price elastic · Necessity of product and how widely product is defined · Proportion of Income Spent on Good o "Cheap" -> Inelastic "Expensive" -> Elastic ○ · Time Period Considered ○ PED inelastic in short term o PED elastic in long term
Knowledge of Price Elasticity of Demand
· Firms ○ Predicting effects of pricing decision on quantity demanded -> total revenue · Government o Consequences of imposing indirect taxes -> total government revenue & unemployment
Price Elasticity of Demand: Commodities and Manufactured Goods
· Primary Commodities (raw materials) Inelastic demand -> necessities, few/no substitutes ○ Consumed by manufacturing industries · Manufactured Goods o Elastic -> substitutes available to consumers Product can be differentiation by different producers
Income Elasticity of Demand
. Income Elasticity of Demand o A measure of how much the demand for a product changes when there is a change in the consumer's income YED = Percentage change in quantity demanded of the product Percentage change in income of the consumer · Range of Values o Normal Goods: YED is positive, Inferior Goods: YED is negative 0 income inelastic . KYED<00 -> income elastic o Necessity Goods Products that have low income elasticity o Superior/Luxury Goods Products that have high income elasticity · Engel Curve O Shows relationship between income and the demand over time Quantity of potatoes demanded 0 Income Type of good YED value Meaning Inferior YED < 0 A given increase in income will lead to a proportionately smaller fall in demand Necessity 0< YED < 1 A given increase in income will lead to a proportionately smaller increase in demand Luxury YED >1 A given increase in income will lead to a proportionately larger increase in demand
Knowledge of Income Elasticity of Demand
· Decision Making by Firms o Planning which markets to enter & which product to sell ○ 1 YED -> large increase in demand as income levels in country rise · Explaining Sectoral Changes in Structure of Economy o Primary sector Primary products (raw materials) o Secondary sector Manufacturing (processing raw materials) o Tertiary sector Services o Sectoral change Shift in relative share of national output and employment that is attributed to each of the production sectors as an economy develops over time for a product
Can’t find what you’re looking for?
Explore more topics in the Algor library or create your own materials with AI.
