Real-time PCR (qPCR): applications and limitations
Slides about Real-time PCR (quantitative PCR or qPCR). The Pdf explores the applications of qPCR, including genotyping, detection of microbes and pathogens, and identification of genetically modified organisms. This material is schematic and suitable for university students in Biology.
See more37 Pages


Unlock the full PDF for free
Sign up to get full access to the document and start transforming it with AI.
Preview
Real-time PCR (qPCR)
Traditional PCR Limitations
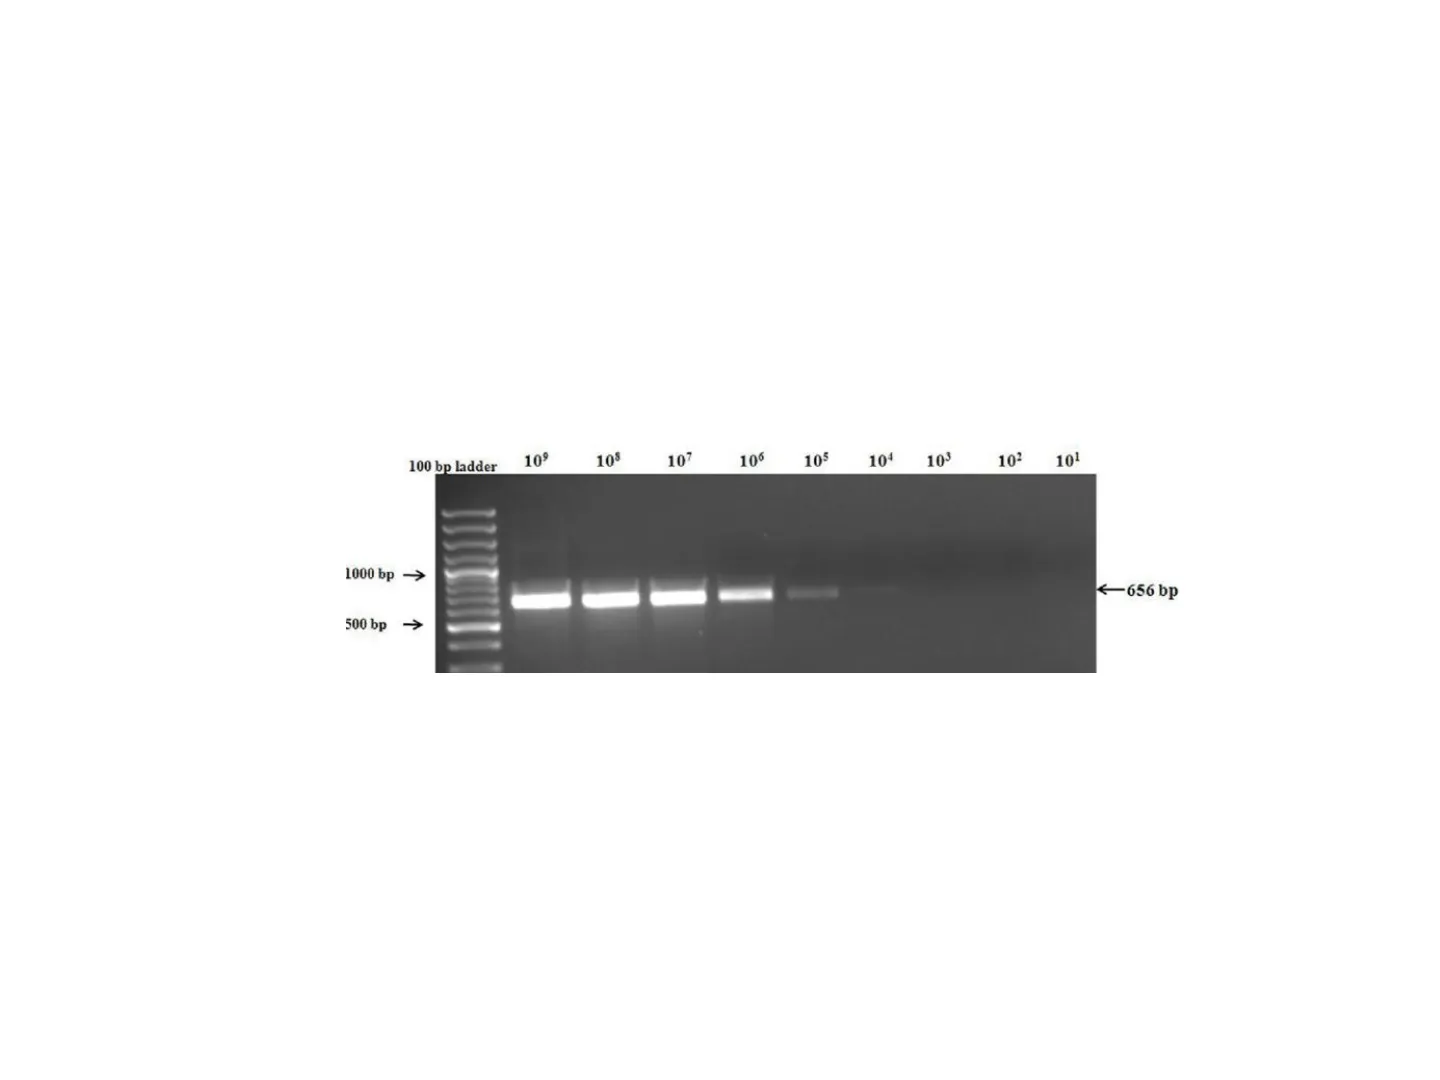
Traditional PCR limits · Qualitative or semi quantitative method (though comparing the intensity of the amplified band on a gel to standards of a known concentration 'semi-quantitative' results can be obtained); . Measuring the amount of accumulated PCR product at the end of the PCR cycles.
100 bp ladder 109 108 107 106 105 104 103 102 101 1000 bp -> €656 bp 500 bp
- Poor Precision
- Low sensitivity
- Short dynamic range
- Low resolution
- Non-automated
- Size-based discrimination only
- Results are not expressed as numbers
- Ethidium bromide for staining is not very quantitative
- Post-PCR processing
PCR Phases
PCR phases · Exponential: Exact doubling of product is accumulating at every cycle (assuming 100% reaction efficiency). The reaction is very specific and precise. . Linear (High Variability): the reaction components are being consumed, the reaction is slowing, and products are starting to degrade. . Plateau (End-Point: gel detection for traditional methods): the reaction has stopped, no more products are being made and if left long enough, the PCR products will begin to degrade.
PCR Phase in Log View
PCR Phase in Log View Traditional PCR detection Area of Detection for Real-Time. Linear High Variability Plateau Ethidium-Gel Detection Log [DNA] Exponential High precision Cycle #
PCR Phase in Linear View
PCR Phase in Linear View Traditional PCR detection Plateau Area of Detection for Real-Time. Ethidium -Gel Detection [DNA] Exponential Linear Cycle #
Plateau Effect in PCR
Plateau Effect . The 10-fold dilution series represented in the figure seem to plateau at the same place even though the exponential phase clearly shows a difference between the points along the dilution series. . If measurements were taken at the plateau phase, the data would not truly represent the initial amounts of starting target material.
Plateau Effect Exponential Phase 1:10 1:100 1:1000 1:100DD
Real-time PCR Technique
Real-time PCR technique . Real-time PCR technique allows to detect the amplification of specific DNA fragment (amplicon) "real-time" by measuring the increase of a fluorescent signal, as the amplification progresses (during the exponential phase).
Intercalating Dyes and Hydrolysis Probes
Intercalating dyes (SYBR-Green) Hydrolysis probes (Taqman Probes)
qPCR Thermocycler Components
qPCR Termocycler FLUORIMETER Monitors the fluorescence signal Î Light source Fluorescence signal Relative fluorescence units PCR Sample THERMOCYCLER Cycles (time) Modulates the reaction temperature
Basic Components of a qPCR Optical System
Basic Components of a qPCR Optical System Detector Optic Bandpass Filter Optic Fluorescence Emission Light Source 1 Dichroic Beam Splitter Bandpass Filter Excitation : Light Plate of 96 "wells" containing PCR reactions The plate sits overa "Thermal Cycler"
Roche LightCycler and Bio-Rad CFX
Roche LightCycler LightCyclef Lasers specific for each excitation wavelenghts... - W 1 Bio-Rad CFX
Real-time PCR Signal Analysis
Real-time PCR Signal ARn Plateau 2,000,000 Sample 1,000,000 Exponential phase Threshold CT 1 1 0 Baseline No template 0 20 40 PCR cycle number Baseline is defined as PCR cycles in which a reporter fluorescent signal is accumulating but is beneath the limits of detection of the instrument. ARn is an increment of fluorescent signal at each time point. The ARn values are plotted versus the cycle number. Threshold is an arbitrary level of fluorescence chosen on the basis of the baseline variability. A signal that is detected above the threshold is considered a real signal that can be used to define the threshold cycle (Ct) for a sample. Threshold can be adjusted for each experiment so that it is in the region of exponential amplification across all plots. Ct is defined as the fractional PCR cycle number at which the reporter fluorescence is greater than the threshold. The Ct is a basic principle of real time PCR and is an essential component in producing accurate and reproducible data.
SYBR-Green Dye
SYBR-Green Mechanism
SYBR-Green · SYBR-Green is an intercalating dye, whose fluorescence greatly increases when it binds to a double-stranded DNA. · Measuring this signal at the end of every thermal cycle will allow to determine the quantity of double-stranded DNA present.
1. Dye in solution emits low fluorescence 2. Emission of the fluorescence by binding
SYBR Green Denaturation Primer SYBR Green I Primer Annealing Extension
SYBR-Green Advantages and Drawbacks
SYBR-Green Advantages: · Easy · Reduced costs · High sensitivity · Versatility . High-throughput Drawbacks: . The dye binds to any double- stranded DNA sequence, could detect non-specific qPCR products · Melting Curves analysis necessary
Melting Curves Analysis
Melting Temperature Definition
Melting Curves • The melting temperature corresponds to the temperature value at which the fluorescence signal is 50% reduced due to the fact that 50% of DNA is denaturated into single-stranded, therefore the DNA-intercalating dye dissociates from double-stranded DNA molecules.
Pre-Melt Region 25% 50% 75% 100% Melt Region Fluorescence Melting Temperature Post-Melt Region Tm 0 20 40 60 80 100 Temperature . Melting curves are obtained at the end of the PCR protocol increasing the temperature from 65 to 95 ℃ with step of 0.5℃ and measuring fluorescence at each increasing temperature step.
Amplification and Melt Curve Charts
Amplification Chart Melt Curve Chart V Amplification Melt Curve 2000 4000 RFU 1000 RFU 3500 3000 500 2500 0 + -0 0 10 20 30 40 65 70 75 80 85 90 95 Cycles Temperature, Celsius Log Scale
Melt Peaks Chart and Analysis
Melt Peaks Chart V Melt Peak HI 500 400 -d(RFU)/dT $00 200 100 0 65 70 75 80 85 90 95 Temperature, Celsius Melting curve analysis is a well-established method for characterizing amplicons. Melting curve raw data is generally represented by plotting fluorescence over temperature. To make analysis more convenient, the negative first derivatives (-dF/dT) are often used, revealing melting temperatures at peaks. 4500 1500
Melting Curve Analysis for Specificity and Mutations
Melting curve Analysis · Unspecific signals · Primer dimers 1,2 - Specific product 1,0 Non-specific amplification 0,8 -d (RFU)/dT 0,6 Primer dimers 0,4 0,2 0,0 55 60 65 70 75 80 85 90 95 Temperature (C) · Single nucleotide modification Homozygous WT Fluorescence Heterozygous Homozygous mutant 50% Tm |Tm Tm Temperature · Homozygous Wild Type: No mutation present in both allele. · Heterozygous: one copy of the gene mutated · Homozygous mutant: both copies of the genes mutated
Hydrolysis Probes
FRET Principle with Hydrolysis Probes
Hydrolysis Probes: FRET · AmpliTaq Gold DNA Polymerase has 5'exo-nuclease activity, that acts upon the surface of the template to remove obstacles downstream of the growing amplicon that may interfere with its' generation. . Fluorescence Resonance Energy Transfer (FRET) is the phenomenon that an excited donor (Reporter) transfers energy to an acceptor group (Quencer). . Hydrolysis probes are small sequences of single-stranded DNA complementary to the template of interest that present a Reporter and Quencer dye. . When the Reporter and Quencer dyes are in close proximity the emission of the Reported is suppressed by the Quencer.
Base removal 000 synthetic 5' nuclease Mg Intact Probe Probe after PCR R probe Q wavelength wavelength Excitation Excitation FRET Fluorescence +TaqMan Probes
TaqMan Probes Mechanism
· TaqMan probes are hydrolysis probes that present a Reporter (high-energy dye) at its 5' end and a Quencer (low-energy molecule) at its 3' end. . When this probe is intact and excited by a light source, the Reporter dye's emission is suppressed by the Quencher dye as a result of the close proximity of the dyes. · When the probe is cleaved by the 5' nuclease activity of the enzyme, the distance between the Reporter and the Quencher increases causing the transfer of energy to stop. The fluorescent emissions of the reporter increase and the quencher decrease.
Annealing R Q Primer Probe Primer Extension Cleavage Signal detection - R Reporter Q Quencer
Beacon Probes
Beacon Probes . Beacon are dye-labeled oligonucleotide (25-40 nt) that forms a U-shape loop. . The 5' and 3' ends of the probe have complementary sequences of 5-6 nucleotides. • The loop portion is designed to specifically hybridize to a 15-30 nucleotide section of the target sequence. . A fluorescent reporter molecule is attached to the 5' end of the molecular beacon, and a quencher is attached to the 3' end. . Formation of the loop is associated with no fluorescence emitted; hybridization with its target results in a fluorescent signal.
R Q Molecular beacons are hairpin probes with reporter and quencher R Q - During annealing, the probe binds to the target sequence to separate reporter and quencher. The reporter fluoresces R Reporter Quencher
Other Hybridization Probes
Other hybridization Probes . The two probes are designed to bind to adjacent sequences in the target. • The probes are labeled with a pair of dyes that exhibit fluorescence resonance energy transfer (FRET). The donor dye is attached to the 3' end of the first probe, while the acceptor dye is attached to the 5' end of the second probe. . During real-time PCR, excitation is performed at a wavelength specific to the donor dye, and the reaction is monitored at the emission wavelength of the acceptor dye.
R2 R1 Donor fluorophore R1 R2 Acceptor fluorophore R1 R2 During annealing, the two probes bind to the target in a head-to-tail orientation. The acceptor fluorophore fluoresces
Reporter and Quencher Combinations
Table 2.1. Commonly used combinations of reporters and quenchers. Reporter Compatible Quencher FAM BHQ1, DABCYL,* TAMRA ** TET BHQ1, DABCYL* HEX BHQ1, BHQ2, DABCYL* TAMRA BHQ2, DABCYL* Texas Red BHQ2, BHQ3, DABCYL* ROX BHQ2, BHQ3, DABCYL* Cy5 BHQ2, BHQ3 * DABCYL is a mechanical quencher only appropriate for molecular beacons. ** TAMRA is not recommended as a quencher, but will work for single-color FAM assays. TAMRA will not work well as a quencher on molecular beacons.
Reporter Dyes Dark Quenchers Ideal Range Useful Range 400 nm Dabcyl Cascade Blue (410) Pacific Blue (455) BHQ-1 Oregon Green (488X) Bodipy FL-X (510) QYS-7 Flourescene (520) 5,6 FAM (518) Oregon creen (52) TET (536) BHQ-2 Bodipy R6G-X 47) JOE (548) HEX (556) Rhodamine Rod-X (580) TAMRA (500) Cy3.5 (596) ROX (605) Texas Red-X (614) Bodipy TR-X (617) Light Cycler 640 (640) Bodipy 630/650-X (650) Cy5 (667) Cy5.5 (694) 700 nm
Hydrolysis Probes Advantages and Drawbacks
Hydrolysis Probes Advantages: · High sensitivity · Target specific (unspecific signal cannot be measured) · Multiplex approach: monitoring the quantity of various qPCR products in a single reaction by adding different primers and TaqMan probes with different reporter dyes to the master mix. Drawbacks: · Expensive · One probe / target . Multiple channels (fluorescence detectors) necessary for multiplex approach
Can’t find what you’re looking for?
Explore more topics in the Algor library or create your own materials with AI.
