Medical image processing and analysis from Alma Mater Studiorum Università Di Bologna
Slides from Alma Mater Studiorum Università Di Bologna about medical image processing and analysis. The Pdf explains the acquisition, storage, and analysis of medical images, distinguishing between low, mid, and high-level operations. The Presentation is useful for University students in Computer science, providing a clear overview of how medical images represent physical phenomena.
See more56 Pages


Unlock the full PDF for free
Sign up to get full access to the document and start transforming it with AI.
Preview
Medical Image Processing and Analysis
STUD
DI BOLOGNA
IORUM
STORICOW
T
CHA. PRA
Posilo Mricerdo
Fas MITC
ZILD Feb 02
11:33:53
256 x 256
REG : 1 0
ISTOBROWN
CER PRA
Fas Cine
By: R.108.7
11:3358
TR:9
TE: 45
CARDE
ET .U
TE: 42
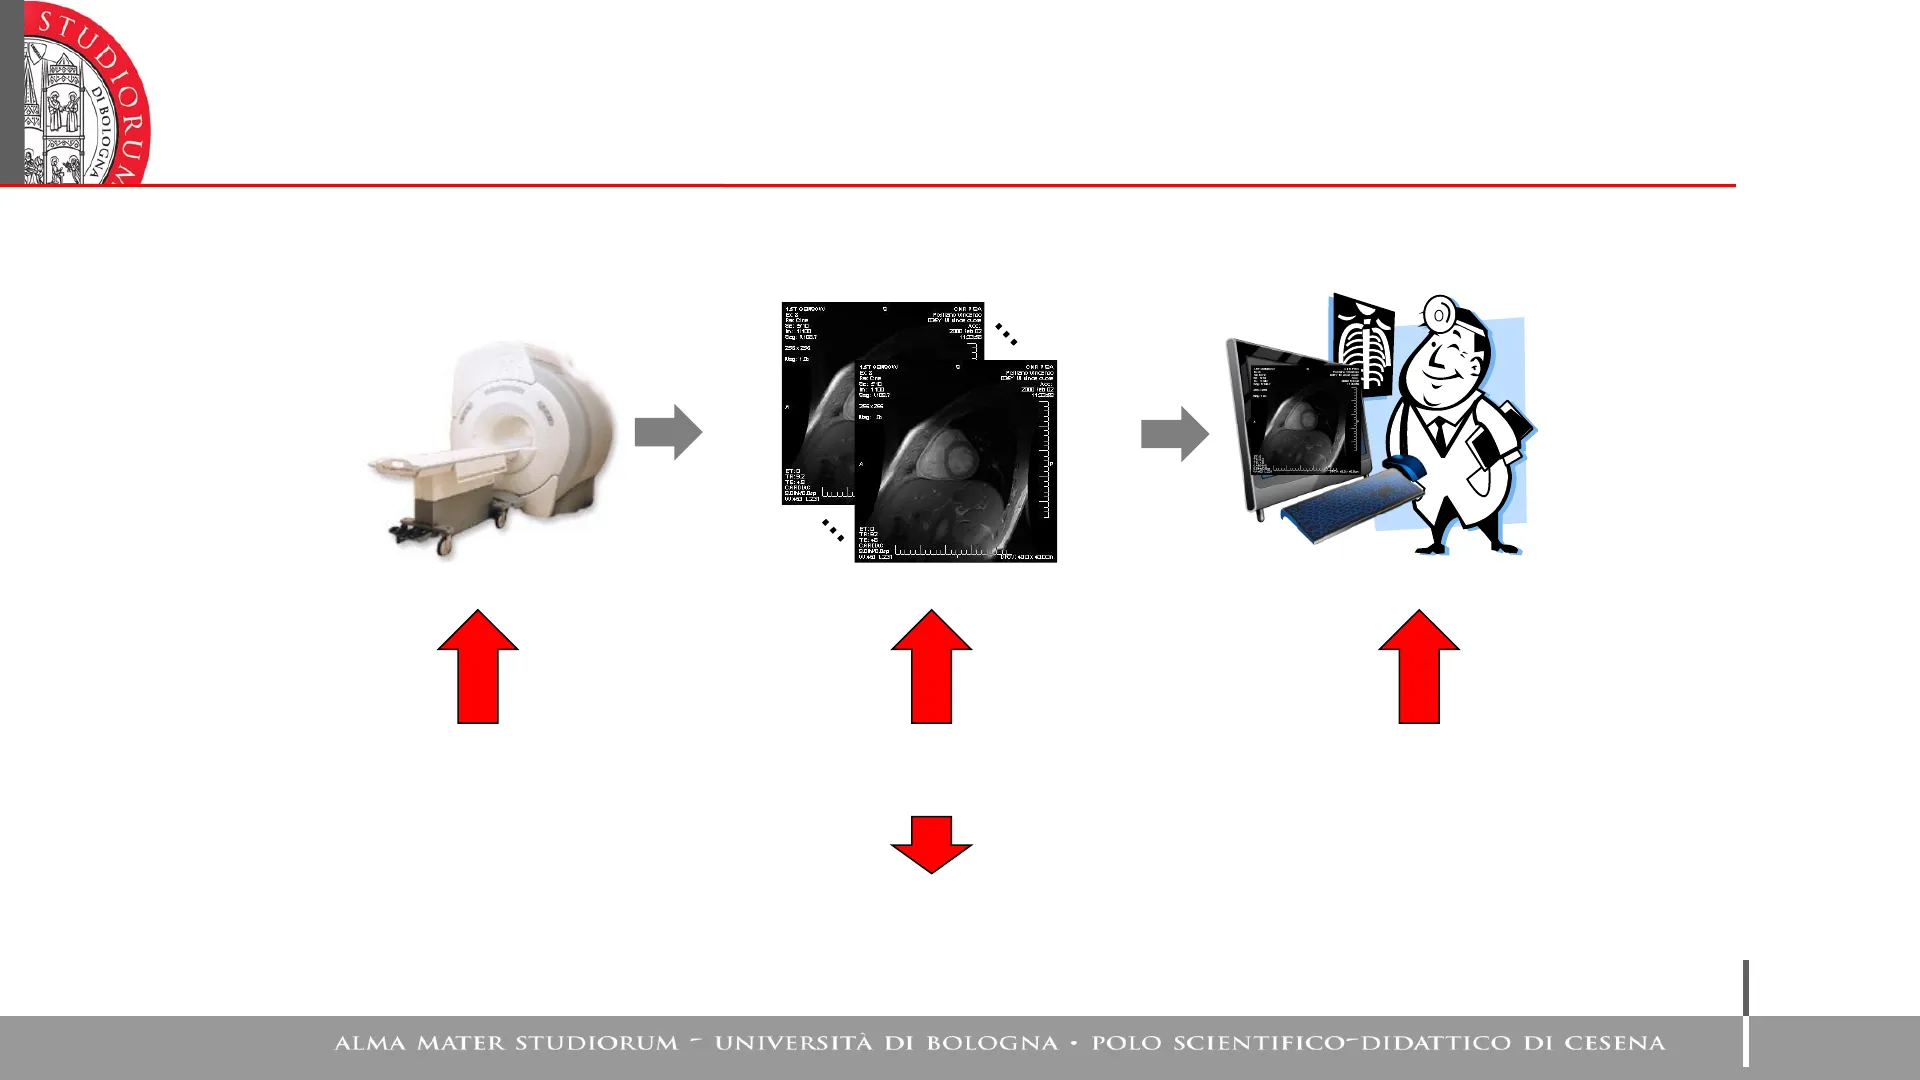
acquisition
storage e communication
processing and analysis
DICOM
ALMA MATER STUDIORUM - UNIVERSITÀ DI BOLOGNA · POLO SCIENTIFICO-DIDATTICO DI CESENASTUD
DI BOLOGNA
IORUM
Processing and Analyzing Medical Images
Process or analyse a medical image?
. To process an image means to enhance or to modify its content
to highlight some particular features
. To analyse an image means to study its content to infer
information to contextualize the represented scene.
ALMA MATER STUDIORUM - UNIVERSITÀ DI BOLOGNA · POLO SCIENTIFICO-DIDATTICO DI CESENASTUD
DI BOLOGNA
IORUM
Understanding Digital Images
What is a digital image?
An image is defined as a 2D function, I(x,y) where (x,y) is the pair of spatial
coordinates and the value of I in (x,y) is the gray level intensity.
If I, x and y are discrete and finite quantities then the image is a digital
image
A digital image is composed by a finite number of elements called pixel
(picture elements), Each pixel is characterized by a position and a value
ALMA MATER STUDIORUM - UNIVERSITÀ DI BOLOGNA · POLO SCIENTIFICO-DIDATTICO DI CESENASTUD
DI BOLOGNA
IORUM
Medical Image Gray Levels
In most cases, in medical images, we measure a single quantity and therefore the
image has only one channel (gray level)
instead of RGB
The gray level is proportional to the physical phenomenon which is measured.
the physical phenomenon depends on the imaging technique
1 ST OBLSOW
00
CNR PBA
Ex: 8
Posi bno Vincerio
Fass Icire
8: 5/10
ACC:
Im: 1/100
2110 Feb OZ
8:0 : R.108.7
11:33:58
295 x 2:56
A
ET:0
TR:92
TE:45
CARD LAO
8.070.Dsp
IN:43 L231
Hole: 00x 00
ALMA MATER STUDIORUM - UNIVERSITÀ DI BOLOGNA · POLO SCIENTIFICO-DIDATTICO DI CESENASTUD
DI BOLOGNA
IORUM
Biomedical Image Data Representation
Biomedical image/data:
single image is acquired but it moves, because is 2D + time
spatiotemporal representation (2D, 2D+t, 3D,
3D+t) of a physical phenomenon/principle linked
to a specific acquisition system
The physical characteristics of a region of space
(pixel/voxel) with respect to some excitation
(opacity to X-rays, magnetic resonance, echo US,
etc) are translated into a numerical signal value.
g(x,y)
I(x,y) : QcR2-> R+
200
100
0
50
100
D
150
20
40
60
80
200
100
120
ALMA MATER STUDIORUM - UNIVERSITÀ DI BOLOGNA · POLO SCIENTIFICO-DIDATTICO DI CESENASTUD
DI BOLOGNA
TA
IORUM
Digital Bio-Image Processing Levels
In this course we will deal with the processing of digital bio-images, using the computer
image processing - image analysis - computer vision
- processing of low-mid-high level
- the first level, low, contains all the primitive pre-processing operations which consist in reducing the
noise due to the acquisition process, improving the contrast and making the image as sharp as possible.
These operations have the peculiarity that both the input and the output are images. - the medium level, mid, consists of the operation of segmenting the image; then partitioning and
classifying the image into regions of interest. In this layer the input is an image while the output is
generally a set of information extracted from the image. - the last level, high, interprets the image, recognizing objects and analyzing them.
ALMA MATER STUDIORUM - UNIVERSITÀ DI BOLOGNA · POLO SCIENTIFICO-DIDATTICO DI CESENASTUD
DI BOLOGNA
IORUM
3D Information from 2D Images
The 3D information is provided in the form of a collection of 2D images or more
....
1
2
3
3D render of the brain
Notice that the areas circled in red have less white area compared
with the other areas. This indicates loss of brain tissue (atrophy).
right
Frontotemporal
Dementia
(FTD)
front
back
front
Semantic
Dementia
(SD)
lott
right
back
right
Progressive
Non-Fluent
Aphasia
(PNFA)
left
right
S
ALMA MATER STUDIORUM - UNIVERSITÀ DI BOLOGNA · POLO SCIENTIFICO-DIDATTICO DI CESENASTUD
DI BOLOGNA
IORUM
Biomedical vs. Normal Digital Images
It is worth noting that there are some fundamental differences between biomedical
images and normal digital images
Channel: Red
Channel:
Green
Channel:
Blue
Link All
Link All
Link All
Max: 255
Max: 255
Max:
255
Min:
0
Min:
0
Min:
0
ALMA MATER STUDIORUM - UNIVERSITÀ DI BOLOGNA · POLO SCIENTIFICO-DIDATTICO DI CESENASTUD
DI BOLOGNA
IORUM
Image Intensities and Tissue Types
tissue
muscle
air
111339
2444.0
170 -
1629.33
-334
35 -
814.66
+ 18
4
0.0
1629 33
0.0
814.66
2444.0
Image Intensities
ALMA MATER STUDIORUM - UNIVERSITÀ DI BOLOGNA · POLO SCIENTIFICO-DIDATTICO DI CESENASTUD
DI BOLOGNA
IORUM
Biomedical Image Display and Color Maps
To sum up:
Biomedical images typically are displayed in gray levels
(US, MRI, CT). The meaning of the gray level depends on
the acquisition physics.
Some non-specific software for the analysis of biomedical images, such
as MATLAB, display a grayscale image with an arbitrary color map does
not allow us to believe that this representation is acceptable.
In some cases (SPECT, PET), standard color maps are
used to display the image in false colors. The color map
used must always be associated with the image.
The "right" way to represent an image basically depends
on an agreement among users.
Immagine originale
50
100
150
200
50
100
150
200
300
350
400
450
Immagine
600
50
-500
100
-400
ODE
150
-200
200
100
50
100
150
200
250
300
350
400
450
ALMA MATER STUDIORUM - UNIVERSITÀ DI BOLOGNA · POLO SCIENTIFICO-DIDATTICO DI CESENASTUD
DI BOLOGNA
IORUM
Raster and Vector Image Representation
An image can be represented either as:
raster image
- uses a grid of small squares which represents the minimum storage unit
each PIXEL (Picture ELements - regular and easily visible structure by enlarging the image) has associated a
position and a color value
they depend on the resolution, i.e. they contain a fixed number of pixels that represent the data in the image
v they are suitable for reproducing subtle chromatic shades
vector image - characterized by elementary structures of a more complex nature (lines, circles, arcs, ... ) defined by vectors
independent of resolution
they are suitable for representing flat characters and images with sharp edges
ALMA MATER STUDIORUM - UNIVERSITÀ DI BOLOGNA · POLO SCIENTIFICO-DIDATTICO DI CESENASTUD
DI BOLOGNA
IORUM
Image Resolution and Quality
The resolution of an image indicates the degree of quality of an image.
It indicates the density of the pixels or of the dots in a linear unit [cm/inch]. It is
measured in DPI (dots per inch) or PPI (pixels per inch)
a digital image of a certain size can be displayed on displays at different sizes.
as the display size changes, the "resolution" of the image changes. What happens if we
zoom in an image? The resolution decreases as the pixel size increases
ALMA MATER STUDIORUM - UNIVERSITÀ DI BOLOGNA · POLO SCIENTIFICO-DIDATTICO DI CESENASTUD
DI BOLOGNA
IORUM
Resolution and Display Size
. The "resolution" depends on the size of the image, but also on the size of the display,
. In other words, the concept of resolution is linked to how dense the points we visualize
are.
Image size
14"
15"
17"
19"
21"
640x480
60
57
51
44
41
800x600
74
71
64
56
51
1024X768
95
91
82
71
65
Image resolution in dot per inch
. On note, a certain "resolution" may not be sufficient if the image must be reproduced in
large dimensions.
ALMA MATER STUDIORUM - UNIVERSITÀ DI BOLOGNA · POLO SCIENTIFICO-DIDATTICO DI CESENASTUD
DI BOLOGNA
IORUM
Resolution and Image Detail
Let's consider an image (a detail of a strawberry) at 200 dpi resolution and
enlarge it by 500%, so we get what you see in the first figure.
then, starting from the same original image, if you first reduce the resolution to
72 dpi and then enlarge it by 500%; the second figure is obtained.
at 200 dpi resolution the number of pixels is much higher than those in the 72
dpi resolution image. Indeed, the pixels of the first figure are much smaller than
those of the second.
A monitor is built to display 72 pixels per inch: if an image is to be displayed at
200 dpi, the operating system, losing details, will re-sample the image at 72 dpi.
The printers have a much higher resolution
a higher resolution allows for more details and for greater chromatic nuances for the same colors
ALMA MATER STUDIORUM - UNIVERSITÀ DI BOLOGNA · POLO SCIENTIFICO-DIDATTICO DI CESENASTUD
DI BOLOGNA
IORUM
Color Depth and Pixel Representation
color depth
In order to process and manage a digital image, the information it contains is expressed in bits.
Depending on the complexity of the tone scale chosen, a byte (8 bit) may contain information relating to
one or more pixels or part of a pixel. A widely used association is to reserve a byte for a pixel, in the case
of gray-level images. This means that we can represent up to 28 = 256 levels of gray.
2 bit
4 levels
4 bit
16 levels
8 bit
256 levels
24 bit
16777216 levels
The number of bits used to represent the level of a single pixel is called color depth and by
having a byte for each fundamental color we can represent 256 * 256 * 256 colors
ALMA MATER STUDIORUM - UNIVERSITÀ DI BOLOGNA · POLO SCIENTIFICO-DIDATTICO DI CESENASTUD
DI BOLOGNA
IORUM
Color Image Representation and Storage
TA
. The representation of a color image varies depending on colors it uses. Usually each
color relating to a pixel is represented by a byte.
. An RGB image uses 3 bytes for each pixel.
file occupancy [byte] = (depth) x (number of pixels)
16 millions of colors
(24 bits)
256 colors (8 bits)
16 colors (4 bits)
ALMA MATER STUDIORUM - UNIVERSITÀ DI BOLOGNA · POLO SCIENTIFICO-DIDATTICO DI CESENASTUD
DI BOLOGNA
IORUM
Color Depth and Image Storage
Color depth: Image storage
. In the case of 8 bit/pixel (bpp) color depth for color images, a color coding system using a palette (color palette)
is used
. The palette is a choice of 256 colors that can be freely divided into millions of colors
. The colors of the palette change according to the image and depending on its content.
0012
3
0 =
1 =
0
1
2
3
2
2 =
1
2
3
2
1
3 =
2
3
2
1
0
3
2
100
A 2-bit-per-pixel image.
The color of each pixel is represented by a number; each number corresponds to a color in the palette.
ALMA MATER STUDIORUM - UNIVERSITÀ DI BOLOGNA · POLO SCIENTIFICO-DIDATTICO DI CESENASTUD
DI BOLOGNA
IORUM
Color Palettes and Lookup Tables
You choose a number of colors equivalent to the number of elements that can be
represented with N bits (i.e. if N=8 you can represent 256 colors) each of them is
associated with an element of a table (lookup table/palette):
- the lookup table is a table of 256 elements;
- the numbers from 0 to 255 represent the indices
- each element contains a different color (RGB)
Each color of the palette is associated with an index that identifies the color in the palette itself.
pros/cons:
v drastic savings in memory and computational time compared to other approaches; - limits the range of colors that can be used to those present in the palette;
- fixed / changeable colors depending on the specificity of an image;
- V
256 colors: when an even greater number of colors is needed, palettes are not used.
Tavolozza standard
di windows
Indice
Colore
RGB
0
#000000
1
#800000
2
#008000
3
#808000
4
#000080
5
#800080
#008080
7
#COCOCO
8
#808080
0
#FF0000
10
#00FF00
11
#FFFF00
12
#0000FF
13
#FFOOFF
14
#00FFFF
15
#FFFFFF
ALMA MATER STUDIORUM - UNIVERSITÀ DI BOLOGNA · POLO SCIENTIFICO-DIDATTICO DI CESENA
Can’t find what you’re looking for?
Explore more topics in the Algor library or create your own materials with AI.
