C1.3 Photosynthesis: Light Energy Transformation and Abiotic Factors
Slides about C1.3 Photosynthesis. The Pdf explores photosynthesis, focusing on solar energy absorption and abiotic factors. It includes a detailed table of contents and a practical exercise to measure the rate of photosynthesis, with tabulated data for analysis. This material is structured to facilitate understanding and autonomous learning for high school Biology students.
See more58 Pages

Unlock the full PDF for free
Sign up to get full access to the document and start transforming it with AI.
Preview
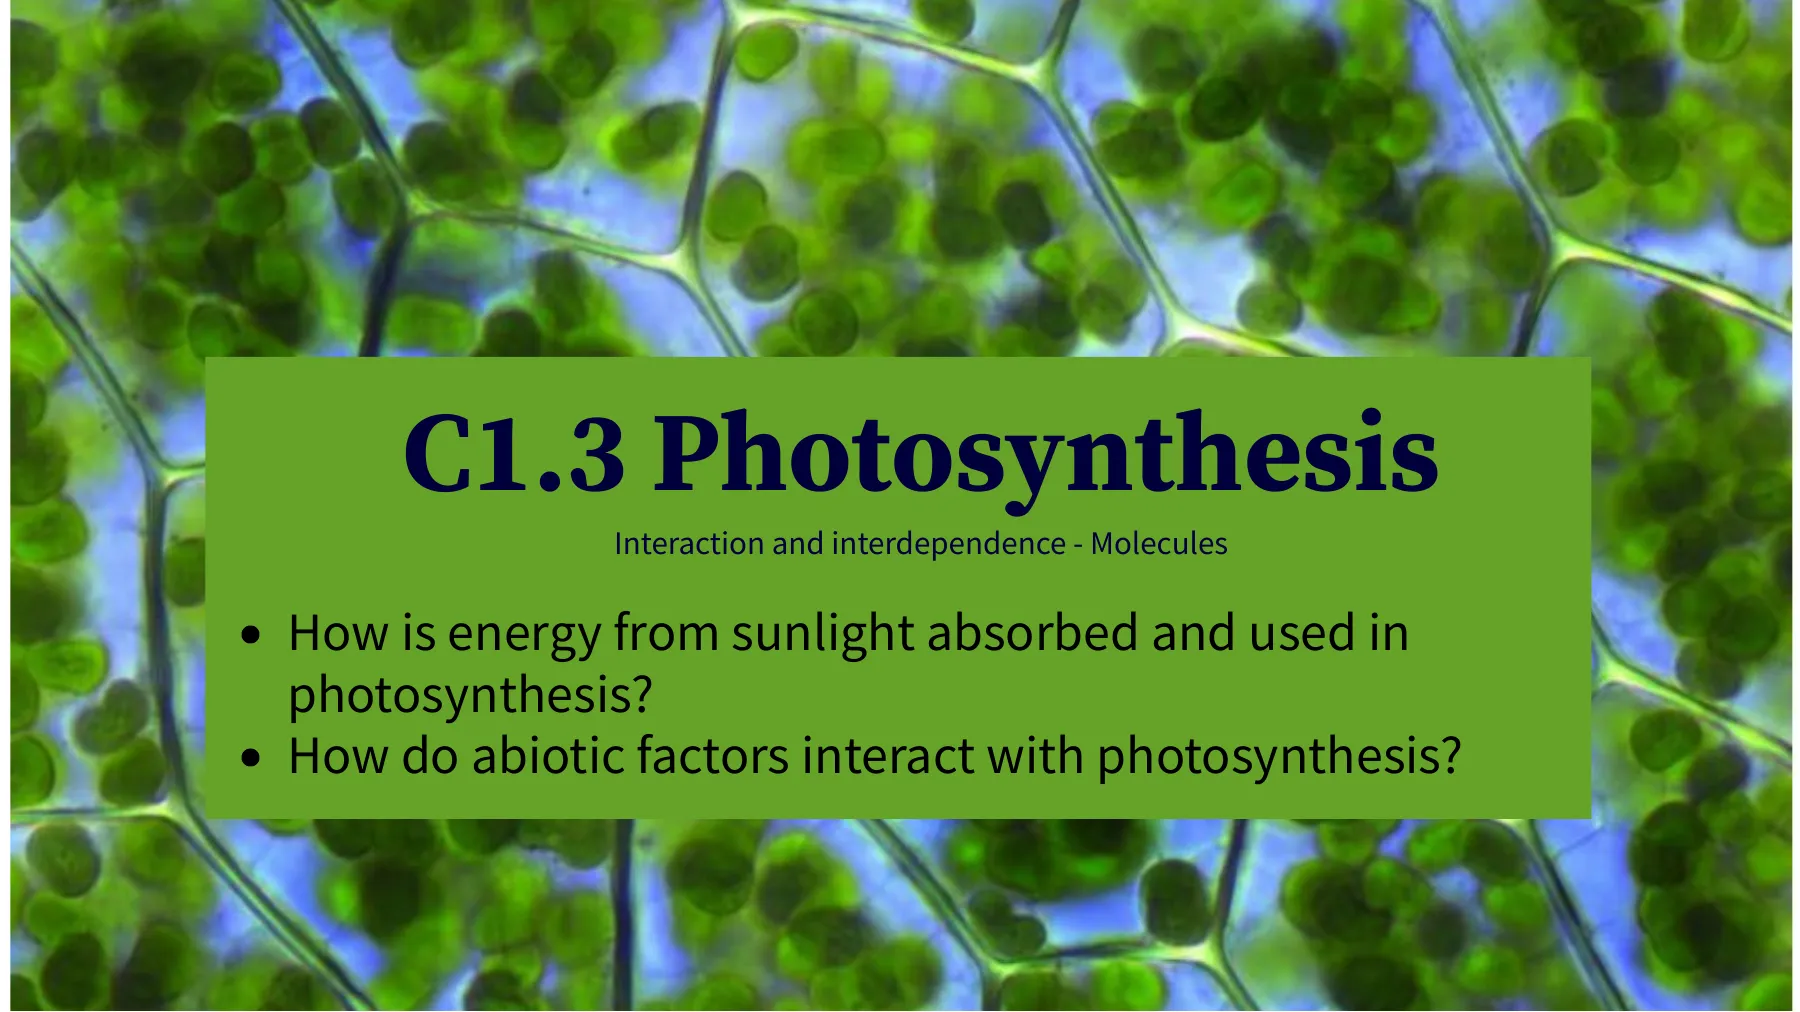
Photosynthesis: Interaction and Interdependence
Molecules
- How is energy from sunlight absorbed and used in photosynthesis?
- How do abiotic factors interact with photosynthesis?
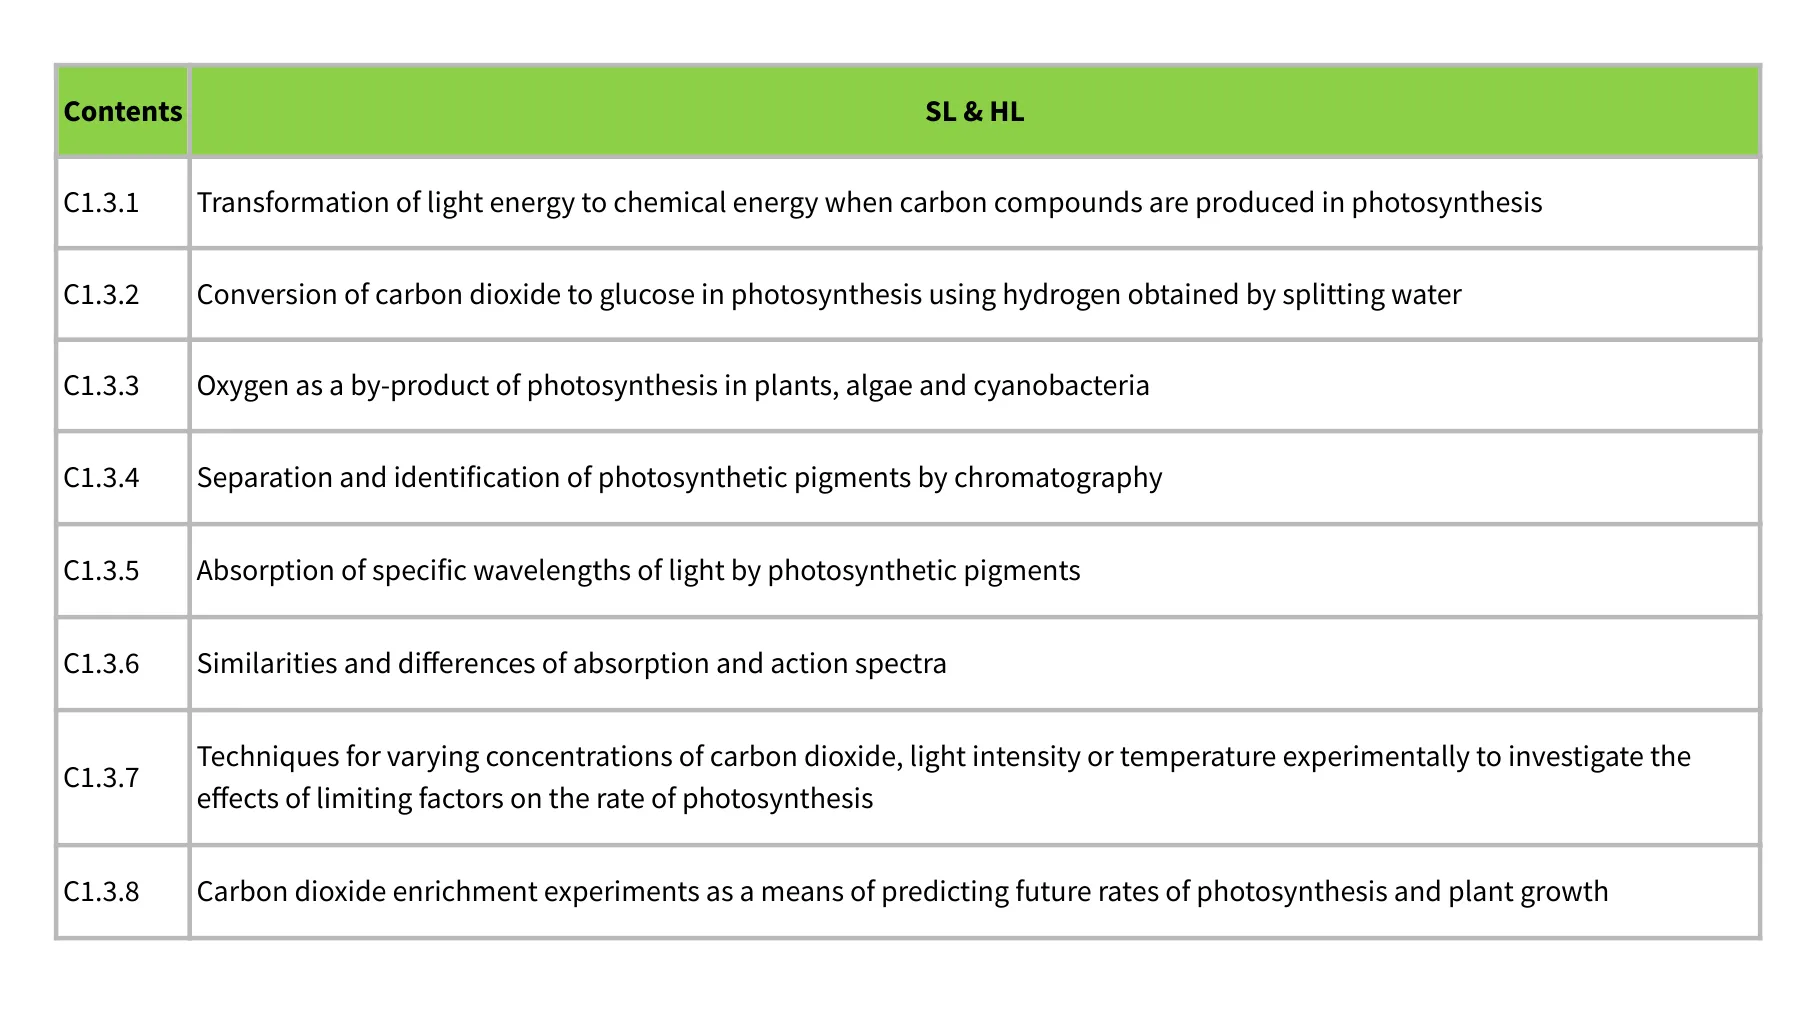
Contents SL & HL
C1.3.1 Transformation of light energy to chemical energy when carbon compounds are produced in photosynthesis C1.3.2 Conversion of carbon dioxide to glucose in photosynthesis using hydrogen obtained by splitting water C1.3.3 Oxygen as a by-product of photosynthesis in plants, algae and cyanobacteria C1.3.4 Separation and identification of photosynthetic pigments by chromatography C1.3.5 Absorption of specific wavelengths of light by photosynthetic pigments C1.3.6 Similarities and differences of absorption and action spectra C1.3.7 Techniques for varying concentrations of carbon dioxide, light intensity or temperature experimentally to investigate the effects of limiting factors on the rate of photosynthesis C1.3.8 Carbon dioxide enrichment experiments as a means of predicting future rates of photosynthesis and plant growth
Transformation of Light Energy to Chemical Energy and Oxygen as a By-Product
Process of Photosynthesis
Sunlight Oxygen Carbon dioxide Sugars Water Adobe Stock | #164537778
Conversion of Carbon Dioxide to Glucose
Photosynthesis Using Light Production
Photosynthesis is a metabolic pathway. Carbon dioxide and along with water is used to produce carbohydrates. Oxygen is released as a waste gas.
6 CO2+ 6H2O sunlight C6H1206+ 602
Light energy is transferred to chemical energy stored in the glucose molecule used in respiration, stored as starch or used to build cell walls as cellulose
Water is split: the hydrogen is used to help in the production of glucose, but the oxygen is excreted as a waste gas.
Carbon is 'fixed' from carbon dioxide and used to produce to glucose.
Photosynthesis: metabolic pathway where light energy is converted into chemical energy and stored into carbon compounds, synthesised from inorganic molecules.
n.b. metabolic pathways are controlled by enzymes
http://i-biology.net/ahl/08-cell-respiration-photosynthesis/8-2-photosynthesis/
Photolysis and Energy Conversion
Photosynthetic Organisms as Autotrophs
One use of the energy consumed in photosynthesis is photolysis (splitting of water molecules) It converts light energy to chemical energy. Photosynthetic organisms are examples of autotrophs.
Light dependent reactions use light energy to produce ATP and to split water (photolysis), making H+ ions
Light independent reactions use ATP and H+ ions to 'fix' CO2, making glucose.
sunlight 6 CO2 + 6H2O C6H1206 + 602
ADP Most of the oxygen is excreted as a waste product Glucose can be used by cell respiration or stored as starch.
photo ATP lysis (light|splits) electrons - O2 H+ ions
n.b. larger molecules tend to contains more bonds than smaller ones. Therefore more ATP is required to build the bonds and generate larger molecules. Consequently large molecules can act as energy stores.
http://i-biology.net/ahl/08-cell-respiration-photosynthesis/8-2-photosynthesis/
Photolysis and Carbon Fixation
Chloroplast Processes
Photolysis: 2H2O + photons -> 4H+ + O2 + 4e-
- Light-dependent reaction
- Requires light . Occurs in the thylakoids of chloroplasts
- The resulting electrons are used to generate ATP
- O2 is a waste product
Carbon fixation:
- Light-independent reaction . Does not require light . Occurs in the stroma of chloroplasts
- conversion of inorganic carbon to organic carbon . CO2 is combined with hydrogen using the energy from ATP to form glucose (C6H12O6 )
Stroma Has appropriate enzymes and a suitable pH for the Calvin cycle Double Membrane Evidence for endosymbiosis (independent origin) Thylakoid Has ETC and ATP synthase for photophosphorylation Granum Flat membrane stacks Increase SA:Vol ratio and small internal volumes quickdy accumulate lons Lamella Connects and separates thylakold stacks (grana)
Light-Dependent and Light-Independent Reactions
The Calvin Cycle
Light-dependent Reactions Light-independent Reactions The Calvin Cycle
Light Stroma H2O CO2 ADP + Pi + NADP+ Granum ATP + NADPH Outer membrane 1/2 O2 GA3P Thylakoid Inner membrane
Oxygen as a By-Product of Photosynthesis
Geological Time and Oxygen Accumulation
1 2 3 4 0.5 0.4 pO2 Atmosphere 0.3 0.2 0.1 0 3.8 3 2 1 0 Geological Time (billion years ago) Maximum Estimated O2 Range Minimum Estimated O2 Range Stage 1 No O2 in atmosphere or oceans Stage 2 O2 produced, but in absorbed by oceans and seabed rock Stage 3 O2 starts to gas out of ocean, but is absorbed by land surfaces Stage 4 Oxygen sinks are filled and O2 starts to accumulate in atmosphere Adobe Stock | #164537778
Oxygen Production by Photosynthetic Organisms
Contribution of Land Plants, Algae, and Cyanobacteria
Land plants 25% and cyanobacteria Micro-algae (phytoplankton) 50% Adobe Stock | #164537778 Macro-algae and seaweeds 25%
Transformation of Light Energy to Chemical Energy
Energy Needs of Living Organisms
What do living organisms need the energy for?
Life Processes Within Cells and ATP Supply
Molecular Transport and Structures
Low concentration of molecules, ions Outside cell I Cell membrane Inside cell ADP + Pi AT High concentration of molecules, ions monomers dimer polymer propeller like motion back and forth beating passiv e part in motion 1) 2 4 basal body Flagellum Cilia water out water out synthase synthase + 5
Energy Flow in Ecosystems
Sunlight as the Principal Energy Source
OXYGEN SUN ENERGY 1 1 1 1 1 PRODUCER CARBON DIOXIDE 1 1 1 1 1 1 A SECONDARY CONSUMER 1 1 1 1 PRIMARY CONSUMER 1 1 1 PRECIPITATION WATER SOIL DECOMPOSER www.earthreminder.com Sunlight is the principal energy source in most ecosystems.
Absorption of Specific Wavelengths of Light
Photosynthetic Pigments and Chloroplast Structure
PHOTOSYNTHETIC PIGMENTS Chlorophyll is a green pigment found in photosynthetic organisms that is responsible for light absorption. . When chlorophyll absorbs light, it releases electrons (used to synthesise ATP) . Chlorophyll absorbs light most strongly in the blue portion of the visible spectrum, followed by the red portion . Chlorophyll reflects light most strongly in the green portion of the visible spectrum (hence the green colour of leaves) Other photosynthetic pigments are xantophyls and carotenes stroma outer membrane thylakoid granum inner membrane lamella
Electromagnetic Spectrum and Pigment Absorption
Wavelengths and Photosynthesis
Visible light 700nm 600nm 500nm 400nm Radio Microwaves Infrared X-rays waves rays Ultraviolet light Gamma rays Longer Wavelength (nm) Shorter 1017 1012 107 103 10-3 10-8 The electromagnetic spectrum The different photosynthetic pigments, such as chlorophyll a and b as well as xanthophyll and the carotenoids, all absorb and reflect different wavelengths of light. The wavelengths reflected give the pigments their colour. The absorption spectrum of photosynthetic pigments Amount of light absorbed -> Carotenoid Chlorophyll a Chlorophyll b L 400 500 600 700 Wavelength of light (nm)
Energy from Absorbed Wavelengths
Light-Dependent Stage and Electron Excitation
The energy from the radiation of absorbed wavelengths drives photosynthesis. The photons of light and the energy they carry excite electrons in the chlorophyll which are then used to power the light-dependent stage. Those electrons are replaced with the electrons released from the photolysis of water.
Light Stroma Photosystem Primary electron acceptor Thylakoid membrane Chlorophyll molecule e Reaction center e Thylakoid space H2O 202 + 2H+
Similarities and Differences of Absorption and Action Spectra
Chlorophyll Absorption vs. Action Spectra
Chlorophyll absroption vs action spectra 100 violet-blue green-yellow ........ orange-red 100 ......... 75 % absorption of light 25 400 500 wavelength of light (nm) 600 700 800
- Absorption spectrum: wavelengths of light absorved by a pigment
- Action spectrum: rate of photosynthesis at different wavelength Absorption spectra for different pigments Which wavelengths are more efficient for photosynthesis?
% use of absorbed light 75 50 50 = 25 1
Measuring the Rate of Photosynthesis
Methods and Changes
How can we measure the rate of photosynthesis?
How can we measure the rate of photosynthesis? Sunlight Oxygen Carbon dioxide Sugars Water
How can we measure the rate of photosynthesis? rate = change/time Which changes occur in photosynthesis?
How can we measure the rate of photosynthesis? rate = change/time 5 2 80 3 CO2 + H2O -> Glucose + O2 thermometer oxygen lamp oxygen bubbles water pond weed light Changes water pH Counting bubbles Collect volume with a siringae Sensor Which changes occur in photosynthesis? 3
Investigation of Elodea Action Spectrum
Experimental Data and Analysis
AoS! An investigation was carried out to determine the action spectrum of an aquatic plant called Elodea. As this plant photosynthesises, it releases oxygen gas which can be collected and measured. Use the data from Table 1 to construct an action spectrum. You will need to calculate means and rates for each wavelength, scale and label your axes appropriately, plot your points accurately and draw a suitable line.
thermometer oxygen lamp oxygen bubbles water X pond weed light
Volume of oxygen produced in 6 hours (ml) Wavelength (nm) Trial 1 Trial 2 Trial 3 Trial 4 Trial 5 Mean Rate (ml/h) 400 17.2 16.5 17.9 16.8 17.6 450 15.1 16.8 15.9 17.5 16.2 Use Excel! 500 7.8 8.2 7.9 8.1 8.3 550 3.6 3.4 3.2 3.7 3.5 600 5.9 6.2 6.4 6.1 6.3 650 14.8 15.2 15.5 14.9 15.3 700 13.7 13.9 14.2 13.8 14.0
Can’t find what you’re looking for?
Explore more topics in the Algor library or create your own materials with AI.
