El sector del vino a nivel mundial: tendencias a largo plazo y situación actual
Diapositivas de Universidad sobre El Sector del Vino a Nivel Mundial - Tendencias a Largo Plazo y Situación Actual. El Pdf, un material didáctico de Economía, analiza la reducción de la superficie vitícola, la producción y el consumo de vino, incluyendo la disminución en China, con datos y gráficos claros.
Ver más20 páginas

Visualiza gratis el PDF completo
Regístrate para acceder al documento completo y transformarlo con la IA.
Vista previa
Universidad Francisco de Vitoria
UFV Madrid
7. El sector del Vino a nivel mundial- Tendencias a largo plazo y situación actual OIV 1 IWSRUniversidad Francisco de Vitoria UFV Madrid
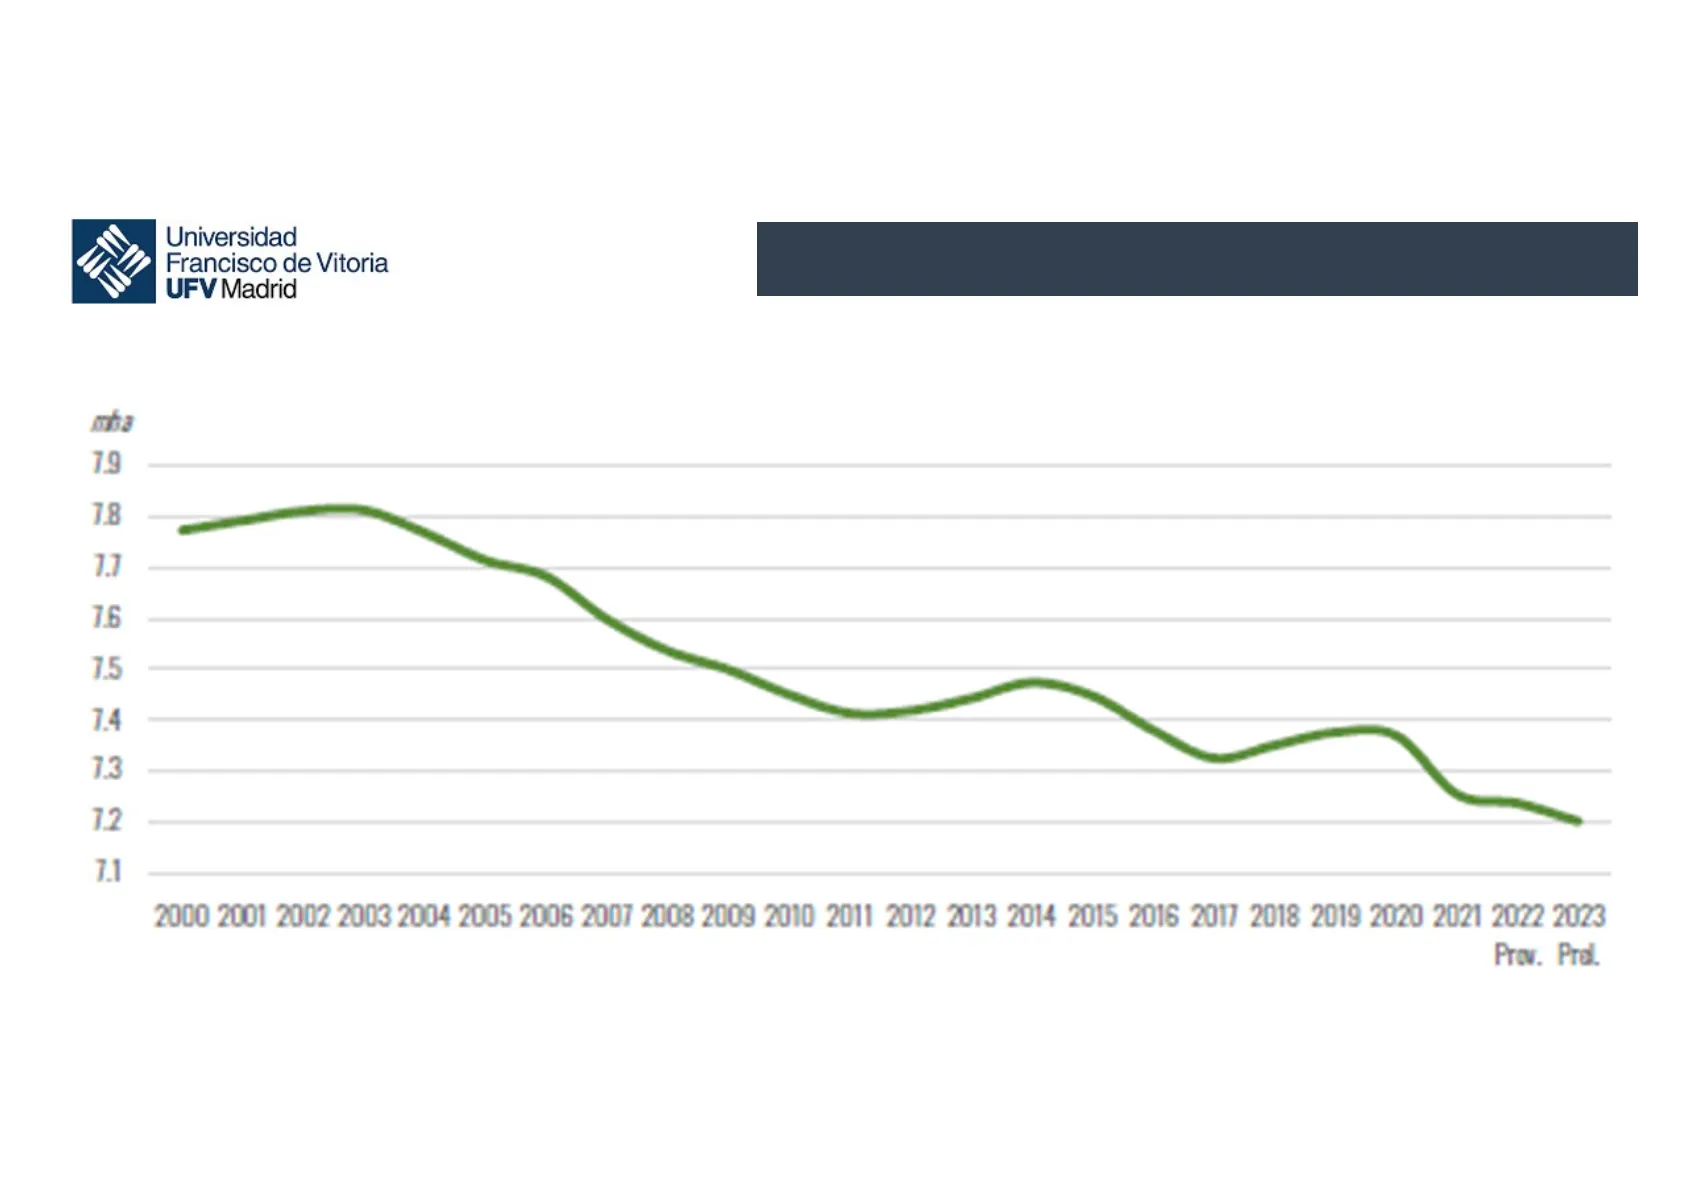
Superficie de Viñedo
Gradual reducción de la superficie de viñedo mba 7.9 7.8 7.7 7.6 7.5 7.4 7,2 mha (-0,5%) 7.3 1.2 7.1 2000 2001 2002 2003 2004 2005 2006 2007 2008 2009 2010 2011 2012 2013 2014 2015 2016 2017 2018 2019 2020 2021 2022 2023 Prov. Prol. Fuente: OIV, Abril 2024Universidad Francisco de Vitoria UFV Madrid
Superficie de viñedo por países
2018 2019 2020 2021 2022 Prov. 2023 Prel. 23/22 % var. 2023 %world Spain 972 966 961 963 955 945 -10% 13.1% France 792 794 799 795 795 792 -0.4% 11.0% China 779 781 766 754 758 756 -0.3% 10.5% Italy 705 714 719 722 718 720 0.2% 10.0% Türkiye 448 436 431 419 413 410 -0.8% 5.7% USA 408 407 402 393 392 392 0.0% 5.4% Argentina 218 215 215 211 207 205 -1.1% 2.8% Romania 191 191 190 189 188 187 -0.5% 2.6% Portugal 192 195 195 194 193 182 -5.8% 2.5% India 149 151 161 167 175 180 2.7% 2.5% Chile 208 210 207 182 182 172 -5.6% 2.4% Iran 167 167 170 165 165 165 0.0% 2.3% Australia 153 159 159 159 159 159 0.0% 2.2% South Africa 130 129 128 126 124 122 -1.9% 1.7% Uzbekistan 108 112 114 118 122 122 0.0% 1.7% Moldova 143 143 140 118 117 117 0.0% 16% Russia 94 96 97 99 101 105 4.1% 1.5% Germany 103 103 103 103 103 104 0.3% 1.4% Afghanistan 94 96 100 100 100 100 0.0% 1.4% Greece 108 109 112 96 93 94 0.9% 1.3% Egypt 80 78 85 83 85 85 0.0% 1.2% Brazil 82 81 80 81 81 83 15% 1.1% Algeria 75 74 75 68 70 70 0.0% 1.0% Bulgaria 67 67 66 65 65 62 -4.6% 0.9% Hungary 69 65 63 63 61 61 -1.1% 0.8% Other countries 817 837 833 822 814 815 0.1% 11.3% World total 7352 7377 7370 7255 7237 7202 -0.5% 100% CON El top 10 concentra un 64% de la superficie mundial de viñedo Fuente: OIV, Abril 2024Universidad Francisco de Vitoria UFV Madrid
Producción de vino
Claramente por debajo de 2022 y la más baja en volumen desde 1961. Es consecuencia del impacto de heladas, sequías, lluvias muy intensas y enfermedades fúngicas sobre la producción en ambos hemisferios. mhl 300 290 280 270 260 250 240 230 M 1 237 mhl (-9,6%) 2000 2001 2002 2003 2004 2005 2006 2007 2008 2009 2010 2011 2012 2013 2014 2015 2016 2017 2018 2019 2020 2021 2022 2023 Prov. Prel. Fuente: OIV, Abril 2024Universidad Francisco de Vitoria UFV Madrid
Producción mundial de vino
Concentración del top 10
El top 10 concentra un 82% de la producción mundial de vino Producción de vino mhi 2018 2019 2020 2021 2022 Prov. 2023 Prel. 23/22 % Var. 23/avg.18-22 % Var. 2023 % world France 49.2 42.2 46.7 37.6 46.0 48.0 4.4% 8.3% 20.2% Italy 54.8 47.5 49.1 50.2 49.8 38.3 -23.2% -23.9% 16.1% Spain 44.9 33.7 40.9 35.3 35.8 28.3 -20.8% -25.7% 11.9% USA 26.1 25.6 22.8 24.1 22.4 24.3 8.5% 0.5% 10.2% Chile 12.9 11.9 10.3 13.4 12.4 11.0 -11.4% -9.7% 4.6% Australia 12.7 12.0 10.9 14.8 13.1 9.6 -26.2% -24.1% 4.1% South Africa 9.5 9.7 10.4 10.8 10.3 9.3 -10.0% -8.3% 3.9% Argentina 14.5 13.0 10.8 12.5 11.5 8.8 -23.0% -29.2% 3.7% Germany 10.3 8.2 8.4 8.4 8.9 8.6 -3.8% -2.9% 3.6% Portugal 6.1 6.5 6.4 7.4 6.8 7.5 9.8% 13.2% 3.2% Romania 5.1 3.8 3.8 4.5 3.8 4.6 21.2% 9.5% 1.9% Russia 4.3 4.6 4.4 4.3 5.0 4.5 -10.0% -0.6% 1.9% New Zealand 3.0 3.0 3.3 2.7 3.8 3.6 -5.8% 14.3% 1.5% Brazil 3.1 2.2 2.3 2.9 3.2 3.6 12.19% 31.4% 1.5% China 9.3 7.8 6.6 5.9 4.7 3.2 -33.0% -53.9% 1.3% Hungary 3.6 2.4 2.6 2.6 2.5 2.4 -2.1% -11.2% 1.0% Austria 28 2.5 2.4 2.5 25 2.4 -6.5% -6.3% 1.0% Georgia 1.9 2.1 2.1 1.9 1.9 1.9 -3.0% -5.8% 0.8% Moldova 1.9 1.5 0.9 1.4 1.4 1.8 27.0% 25.0% 0.7% Greece 2.2 2.4 22 2.4 21 1.4 -34.4% -39.7% 0.6% Switzerland 1.1 1.0 0.8 0.6 1.0 1.0 1.8% 11.6% 0.4% Other countries 15.6 14.5 14.0 13.4 13.6 13.2 -2.7% -6.9% 5.6% World total 294.8 257.9 262.2 259.7 262.6 237.3 -9.6% -11.3% 100.0% Fuente: OIV, Abril 2024Universidad Francisco de Vitoria UFV Madrid
Consumo de vino
El retroceso se debe principalmente a una caída del consumo en China. En paralelo, se ha producido un incremento generalizado de precios, en parte relacionado con los conflictos en curso y las tensiones en las cadenas de suministro. mhl 255 250 245 240 235 221 mhl (-2,6%) 230 225 220 215 2000 2001 2002 2003 2004 2005 2006 2007 2008 2009 2010 2011 2012 2013 2014 2015 2016 2017 2018 2019 2020 2021 2022 2023 Prov. Prel. Fuente: OIV, Abril 2024Universidad Francisco de Vitoria UFV Madrid
Consumo de vino por país
Concentración del consumo mundial
Consumo de vino mhl 2018 2019 2020 2021 2022 Prov. 2023 Prel. 23/22 % Var. 2023 % world USA 33.7 34.3 32.9 33.1 34.3 33.3 -3.0% 15.1% France 26.0 24.7 23.2 24.9 25.0 24.4 -2.4% 11.0% Italy 22.4 22.6 24.2 24.2 22.4 21.8 -2.5% 9.9% Germany 19.7 19.5 19.8 19.9 19.4 19.1 -1.6% 8.6% UK 12.9 12.6 13.7 13.9 13.1 12.8 -2.9% 5.8% Spain 10.7 10.2 9.2 10.3 9.6 9.8 1.7% 4.4% Russia 8.6 8.7 8.5 8.1 8.4 8.6 3.0% 3.9% Argentina 8.4 8.5 9.4 8.4 8.3 7.8 -6.2% 3.5% China 17.6 15.0 12.4 10.5 9.1 6.8 -24.7% 3.1% Portugal 5.1 5.4 4.4 5.3 6.1 5.5 -9.2% 2.5% Australia 5.3 5.8 6.0 5.6 5.4 5.4 -0.1% 2.4% Canada 5.1 5.2 5.3 5.3 5.1 4.8 -5.6% 2.2% South Africa 4.0 3.7 3.0 3.9 4.6 4.5 -1.8% 2.0% Brazil 3.3 3.6 4.1 4.1 3.6 4.0 11.6% 1.8% Netherlands 3.6 3.5 3.7 3.7 3.6 3.3 -9.2% 1.5% Japan 3.5 3.5 3.5 3.1 3.2 3.2 2.1% 1.5% Romania 3.9 2.2 2.6 3.7 2.5 3.0 20.1% 1.4% Switzerland 2.4 2.6 2.5 2.6 2.4 2.3 -3.0% 1.0% Austria 2.4 2.3 23 2.4 2.4 2.3 -2.1% 1.0% Czech Republic 20 22 2.1 22 2.2 22 -3.7% 1.0% Other countries 38.8 39.5 38.6 38.6 36.6 36.3 -0.8% 16.4% World total 239 236 231 234 227 221 -2.6% 100.0% El top 10 concentra un 68% del consumo Fuente: OIV, Abril 2024Universidad Francisco de Vitoria UFV Madrid
Comercio internacional de vino
Volumen y valor
Volumen 120 99,3 mhl (-6,3%) 110 100 90 80 70 60 50 2000 2001 2002 2003 2004 2005 2006 2007 2008 2009 2010 2011 2012 2013 2014 2015 2016 2017 2018 2019 2020 2021 2022 2023 ba EUR Valor 40 35 30 36.0 bn € (-4,7%) 25 20 15 10 2000 2001 2002 2003 2004 2005 2006 2007 2008 2009 2010 2011 2012 2013 2014 2015 2016 2017 2018 2019 2020 2021 2022 2023 El descenso en valor es menor que en volumen, por un incremento de los precios medios de exportación. Casi la mitad del vino que se consume en el mundo es importado. Fuente: OIV, Abril 2024 ~ 1Universidad Francisco de Vitoria UFV Madrid
Precio medio de exportación
EURA 3.9 3,62 €/l 3.7 3.5 3.3 3.1 2.9 2.7 2.5 2.3 2.1 1.9 1.7 2000 2001 2002 2003 2004 2005 2006 2007 2008 2009 2010 2011 2012 2013 2014 2015 2016 2017 2018 2019 2020 2021 2022 2023 Fuente: OIV, Abril 2024Universidad Francisco de Vitoria UFV Madrid
Comercio internacional de vino por tipo de producto
Volume (mhl) Value [bn EUR) Type Vertical Structure In 2023 Var. 23/22 2022 2023 2022 2023 volume value volume value Bottled (< 21) 52% 67% -9% -6% 106.0 99.3 37.8 36.0 Sparkling BiB 11% 25% -4% 1% 4% 2% -4% 0% variation of -6.3% variation of -4.7% Bulk (> 10 1) 33% 7% -4% -10% Fuente: OIV, Abril 2024 Solamente los espumosos crecen en valor y pesan ya un 25%. El resto de vino embotellado cae más en volumen que en valor por la subida de precios. Las ventas de granel pierden peso en valor.Universidad Francisco de Vitoria UFV Madrid
Principales exportadores de vino
Volume (nhl) Vertical Structure in 2023 volume value Variation 2023/2022 valana 2022 2023 2022 2023 bottin (< 2 1) sparkling B&B 55% 24% CON 29%. -4% -2% Paly 8% variation of -1.0% variation of -0.8%%. bulk (-20 1) 12% 2% 4% -2% 12% 21.4 20.8 3 007 2.200 bottin (< 2 1) sparkling B&B 77% 17% 4% 50% 38% 1% -10% -10% 4% France variations of -5.8% variation of -2.8% bottle (< 2 1) 50% 81% -ZIN 25% 2 6.8 1421 sparkling BAB 25% -8%% -30% -B% -ZIN variation of -1R.IN. vartation of -22.4% bottin (< 2 1) 72% 64 62 1381 1 243 xparkline B&B -0% -125% -17%% variation of -2.9% vartation of -30.05% bulk (+30 1) bottin (< 2 1) xparking BIB 41% 70% 4.4 35 GEO 571 bulk (-30 1) 21% -35% 25% -27% 22% variation of -20.3% 3.5 1047 1055 BAB bulk (-20 1) bottin (< 2 1) sparkling BAB bulk (>20 1) 3% 20% 3.3 230 -xx Porta gal variation of -1.8% vartation of-1.2% bottin (<2 1) xparking BAB 28%% 2% 47% 21 23 10% Canada variations of 61% variation of 7.4%. bottin (< 2 1) 50% -20% USA 28 2.1 1 401 1135 xparking B&B bottje ( 2 1) xparking 2% -45% Argentina 27 2.0 752 1200 bottle (< 2 1) xparking B&B 57% 74% -9% -20% -22% Now Zealand variation of -26.3% variation of -21.7%. bulk (-30 1) 41% 25 -27% AG% -34% -50% variation of -263% variation of -198% buik (-30 1) 22% -25% -20% 83% -xx 3% variation of -25.8% wartation of -19.3% bulk (>30 1) 30% -Cx -8% -2% -40% 2% 5% -50% variations of -80 variation of 0.8% bottle (< 2 1) 73% 78% 13% Carmany bulk (-20 1) 41% 3% -1% variation of -2.9% variation of -3.2% bulk (-20 1) 134 12.7 12 222 12 5X37 bulk (>20 1) 216 214 7726 7735 Italia y España lideran en volumen, Francia en valor. Fuente: OIV, Abril 2024 bulk (-20 1) 0% 20% 8% -34% -8% 15% 5% -27% 3% 2% -5% -30% -24% -50% -30% 27 2.0 134 -11% Australia Saeth Africa -10% -5% bottin (< 2 1) sparkling
Principales importadores de vino
Volume (nhf) 2022 2023 2022 2023 bottin (< 2 1) x% 5% 62% 1% Carwany variation of -0.5% 12.3 4 821 4 CG3 bottin (< 2 1) sparkling B&B 49% 15% 62% 20% 4% UK variation of-5.7% vartation of -1.3% bottin (< 2 1) sparkling 70% 25 -115 France variations of - 4.0% variation of -3.5% Nathorlands 4.4 4.4 1506 2 508 bottin (< 2 1) sparkling 87% 83% 139 variation of 0.5% variation of 0.8% truck: (-10 1) bottin (< 2 1) sparkling ... - wartation of 2.0% variation of - bruik: (+10 1) Canada 4.2 3.8 2167 1846 bottin (< 21) sparkling 57% 20% 63% 20% -9% Balgias -8% -9% variation of -30.8% vartation of -2.8% bottin (< 2 1) sparkling B&B 20% 37% 15% -30% -28% -12% 3.4 25 1 300 1 072 bottin (< 21) sparkling 80% 55% 42% -11% -10% -00% 27 23 1720 1 644 bottin (< 2 4) sparkling B&B 20% 27% 5% 2.0 20 461 547 1% KZK 0% 15% -115% 25% 44% 21 2.0 852 832 bottin (< 21) sparkling 40% 13% 58% -9% Swodan -19% 박 경 주 習 variation of -7.7%. variation of -2.2% bulk: (+10 1) zzN. 2% 20 3.0 192 Portugal -35% variation of 3.3%%. variation of -24% bulk (-10 15 70% 40% variation of-26.3% variation of -21.7% bulk (+10 8) 35% -38% Japan variations of -12.5% variation of-73% 2% -19% -20% Fuente: OIV, Abril 2024 Type Vertical Structura In 2023 volume Variation 2023/2022 volume 13.6 13.6 2 776 2648 vartation od -4.6%. SG%. 18% -2% 5% 3% bulk (+10 1) 36% 37% variation of -14.0% variation of -11.5%% 6.2 6.0 957 bottin (<2 5) sparkling bruk: (+10 1) 84% -30% -12% -15% ** IN vartatices cf -30.2% vartation of -34.8% bruck (-10 1) bottin (€ 21) sparkling B&B brudk: (+10 1) 5% -= % 3.0 1301 1 174 30 4.0 12.3 € 290 EEUU, Alemania y Reino Unido mantienen las 3 primeras posiciones como importadores, aunque todos descienden. variation of 0.6% variation of 18.7% trudk: (+10 1) bottin (< 24) sparkling
¿Non has encontrado lo que buscabas?
Explora otros temas en la Algor library o crea directamente tus materiales con la IA.
